Wednesday, October 31, 2012

The problem with an infrequently-traded system...

... is that you lose touch with the market. A low-volatility candle appeared on the AUDJPY a few days ago.


If you tried to trade the break of both the high and low of the candle with anything greater than a 1:1 R:R, you would've been whip-sawed out.
 
(Un)fortunatelly, I decided to ignore the market that particular day and simply focused on my research and backtesting.
 
That is the trouble with an infrequently-traded system. If you're potentially waiting 2+ weeks for your next entry signal, you can forget that you're trading live. I feel very much as if I'm back in "demo mode".
 
I will notch this up as a lesson in trader psychology. As a trader, you have to understand your psychological profile, and I believe I'm one of those traders who needs to be in the market frequently to remain engaged.

Saturday, October 20, 2012

Little update - loose pinbar backtest

My preliminary backtest on my mechanical pinbar system showed a profit factor hovering between 1.15 and 1.3. This week, I decided to stress-test the system with the entirety of data I had for the EURUSD and NZDUSD from 2001 to 2012. 
 
My profit factor turned out to be a little less than 1.0. It was almost as if I was trading randomly. As to the discrepancy, I'm not sure how to explain it. I suppose you have a system, and it performs okay 90% of the time. However, it may hit a pocket of "bad luck" 10% of the time where consecutive trades fail. Random sampling may not pick up on these pockets, especially if the pockets and/or sampling is too small. Either that, or I was just lucky with my preliminary sampling.
 
I added an RSI(10) filter to measure the trend. Pinbars tend to behave as trend-reversal signals, but they can also act as trend-continuation signals, as seen below:


As you may see, my criteria for a "tradable" pinbar is very loose. I totally ignore the prominence of the pinbar's "nose" with regards to to the previous candle e.g. the noses of the very first and very last pinbars don't even break the previous day's low. The open and close of the candle must also occur only in the top or bottom 50% of the pinbar, which is also very loose. I'll explain more if my backtest continues to be positive.
 
Adding an RSI filter improved my results significantly. Here are the results, filtered with the RSI indicator. Basically if RSI(10)>50 and we have a bullish pinbar, we're trading with the trend. If the pinbar is bearish, we're against the trend. Vice versa when RSI(10)<50.


Trading with a 2:1 reward:risk seems best. I used an ATR(14) * 0.5 for my stop loss. As you can see, going against the trend was very bad. The backtest so far suggests a frequency of 1.5 signals a month per currency pair, which is very good (trading six pairs = 2 signals a week), and compensates for the relatively low profit factor.
 
The next step(s) is to test the other pairs, of course. This may take awhile. Any suggestions on improving this system are welcome.

Friday, October 19, 2012

If you want to be inspired...

... go on Youtube and look up "Shark Tank" or "Dragons Den". In these two shows, budding entrepeneurs pitch their business ideas to ultra-rich investors and venture capitalists. This is capitalism at its finest.


Thursday, October 11, 2012

Conclusion: EURGBP is driven by fundamentals

I spent an hour brewing over the EURGBP and I've concluded that price action on the EURGBP is driven mostly, or perhaps even purely, by fundamentals (by fundamentals, I mean factors outside the EURGBP chart). Some technical analysis will be useful, but a purely-technical trade will have difficulty on the EURGBP. I will explain why.
 
The EURGBP represents the difference between the EURUSD and GBPUSD. The EURUSD and GBPUSD make up 28% and 9% of the forex market, respectively. The EURGBP makes up 3%.
 
The combined market share of the EURUSD and GBPUSD is 37%. Technical traders on the EURUSD and GBPUSD overpower those on the EURGBP by a factor of over 10:1 (37% vs 3%). If I see two signals on the EURUSD and EURGBP, which one will most technical traders trade? Most likely the EURUSD. The technical signal on the EURGBP will be overshadowed by the signal on the EURUSD. Any technical trader on the EURGBP will be a fart in the wind.
 
This is a very simplistic argument, but I hope to illustrate the principle I thought of. The technical side of the EURGBP will mostly be found on the EURUSD and GBPUSD. The EURGBP just measures the difference between the two pairs and shouldn't be traded on technicals.

Backtest on USDJPY and EURGBP complete, thoughts on EURGBP

I just finished gathering 200 more "pinbar" samples from the USDJPY and EURGBP. The USDJPY passed fine, but the system got completely annihilated on the EURGBP. Profit factor ranged from 1.0 to 0.5 with all reward:risk ratios up to 5:1. Above that, the system becomes profitable.
 
Half of Britain's exports go to Europe, according to this article. Generally, this should mean that the British and European economies will march in-step. Because of this high correlation, the EURGBP will tend to be range-friendly, or perhaps even whip-saw friendly (pinbars should be profitable in a ranging market if R:R is small enough, but I was getting stopped out so many times).
 
The EURGBP is somewhat liquid, making up 3% of all volume traded in the forex market.  Therefore the whip-sawish action isn't so much due to illiquidity, but perhaps more to do with Britain and Europe itself.
 
I suspect that the AUDNZD would follow similar behaviour, considering how tightly correlated both economies are (both economies are commodity export-driven and 23% of NZ's exports go to Australia).
 
I think there is something here to explore in future.

Pinbar backtest - 40% complete

I'm currently backtesting a mechanical system based on pinbars, but with my own modifications. Profit factor is hovering between 1.15 and 1.3 at the moment. I've only gathered 400 trades from four pairs so far (GBPUSD, EURUSD, AUDUSD, USDCHF) between 2001 and 2012. The goal is to gather 1,000 samples. What's making this system real juicy is the frequency of trades. If I trade the top 8 liquid pairs, the results suggest a frequency of 6-8 trades per week.

Saturday, October 6, 2012

Relationship between profit factor and risk per trade

I stumbled upon this discovery by accident.
 
As a general rule of thumb, traders risk 1-2% of their equity per trade to control their drawdown when they lose.
 
It's also another general rule of thumb that if you are using a trading system, you optimise the variables within the system to maximise your profit factor (within reason - if you over-optimise, you end up curve-fitting which has little predictive value).
 
Thus, we trade a system with maximum (or near-maximum) profit factor, and risk 1-2% of our equity per trade.
 
I will explain why this may in fact sub-optimal under certain conditions.
 
I was tinkering with my low-volatility breakout system "Hermes" and found that a reward:risk of 0.5:1 provided a better profit factor than reward:risk of 2:1 (1.49 versus 1.33, respectively). One of the trading mantras you'll find on the internet is "never trade below 2:1!", which is why I tended to disregard any R:R below 1:1.
 
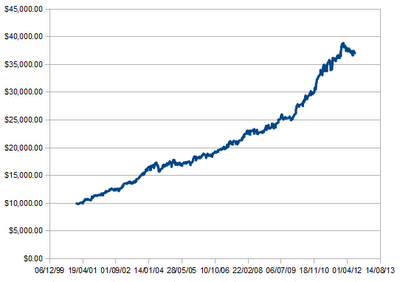
Nevertheless, I decided to plot the equity curves for 2:1 and 0.5:1 R:R, at 1% equity risk per trade. Results are below.

Equity curve for 2-to-1 reward-to-risk, profit factor = 1.33, risking 1% equity per trade.


Equity curve for 0.5-to-1 reward-to-risk, profit factor = 1.49, risking 1% equity per trade.

 
As you can see, increasing my profit factor actually harmed the growth of my equity. What's going on!?
 
I spent two days scratching my head, re-checking my maths and wondering what the hell happened. These are two versions of the same system, so the number of trades hasn't changed at all. The only difference between the two system versions was my R:R and nothing else. The system with the higher profit factor should be growing faster, not the other way around.
 
I began to examine my % equity risked per trade, and thought about the Kelly criterion. The Kelly criterion provides a mathematical method of finding your optimal risk per trade. I decided to find the optimal risk level for 2:1 and 0.5:1 R:R, which turned out to be 11% and 28% if I remember correctly.
 
Thus, when my risk was at 1% (when I graphed my equity curve), my risk level is more optimal for 2:1 R:R than 0.5:1 R:R. 1% is closer to 11% than it is to 28%, and thus my equity would grow faster using a R:R of 2:1 than 0.5:1, despite having a lower profit factor.
 
That was a startling discovery, and something I've never read in any trading book so far. It goes to show why a serious trader must do his own homework rather than rely on hearsay from experts or the internet. I'm now wondering if professional traders are aware of this paradox?
 
Now, this dilemma can be solved quite easily if you base your equity risk per trade on some derivative of the Kelly criterion rather than an arbitrary rule like "2%", which is espoused in some trading books. For example, you may risk 10% of Kelly, in which case I would risk 1.1% per trade if I'm using a 2:1 R:R, and 2.8% if I'm using 0.5 R:R. In this case, 0.5 R:R will build equity quicker and all is well.
 
Important lessons:
 
1. Do your own homework
2. Question EVERYTHING, even if it comes from Dr. Alexander Elder (i.e. the 2% rule)
3. Use context-sensitive, self-adjusting rules rather than hard, arbitrary rules

Monday, October 1, 2012

Missed out on a winner - "Hermes"

I missed an entry on the USDJPY due to a mental miscalculation. The range on the USDJPY was 17 pips on the 27th of September, less than 50% of ATR(14). However, I did a quick mental calculation and thought it was 27 pips and ignored the entry signal.


If I did trade this, the low of the entry signal bar would've broke and trigger a short, resulting in a loss. However, price rebounded and broke the high. A long with a 2-to-1 risk-reward would finish in profit today.
 
The lesson here? I need to learn how to program indicators in MT4! And to be less careless with my mental arithmetic.