Tuesday, October 29, 2013

Intra-day data solutions

My intra-day system development took a setback due to confusing 5M data. I'm now testing a Tokyo open, range breakout system. The problem is that pinpointing historical opening times can be very confusing due to changes in daylight savings, AND the fact that brokers aren't always clear in how they set their server time.

It took a whole day to find what I think is a solution to this problem. I use Forex Tester 2 to backtest historical data. For actual data to backtest on, I've used a standard subscription with Forex Tester, which gives me 5M data from different brokers like Alpari, FXCM, Forex.com etc. 

The best data for intra-day trading, IMO, is FXCM. Their server time is set to GMT, so there's no confusion over daylight savings (unlike other brokers, which may set their time to local time or the NY close). This allows you to accurately pinpoint the start and end of various market sessions. Plus their data is 5-decimal digits (or 3-decimal digits for JPY pairs).

As for finding actual market session times, there are threads by Clint on Babypips that contain this information. e.g. Forex Trading Sessions --- September 2012 - April 2013. You can use the search function on the forum to find times for other months. This saved me alot of headache!

Saturday, October 26, 2013

Week in Review: 21st October 27th October 2013

Last week, I saw three signals that I liked - USDCAD and NZDJPY on the daily chart, and gold (XAUUSD) on the weekly chart. Just before Monday opened, I realised that all three pairs were commodities (CAD, NZD and gold) and felt uneasy opening all three trades. I decided to trade the USDCAD on Monday and stay out of NZDJPY and gold. 

By Monday's close, the USDCAD triggered my long, but barely moved up. In fact, volatility on Monday fell further. On Tuesday, the NFP for September came out and reversed the USDCAD. 


Just before the NFP came out on Tuesday, I examined the situation and felt uneasy keeping my trade open. NFP is one of the most volatile news releases in forex, and I questioned whether it was wise to risk 1R for a 0.5R reward as my system dictated. Additionally, a profit target of 0.5R usually gets hit on the day my order is triggered, which didn't happen here.

Risking 1R for 0.5R was a stupid logic to use prior to a news release and since I didn't have a system to trade news releases, I decided to close and take profit, albeit a small profit. But it was a good decision since the NFP came out below expectations and would've taken out my stop loss. I think this was good trader thinking. 

System Development

I'm still backtesting data on the EURJPY 5M chart with different filters and exits etc. I'm trying to generate more entries. ATM it remain very positive, but I want to be sure of my results before I post anything. This may take awhile. 

Monday, October 21, 2013

Interesting development on my EURJPY 5M system

I just finished backtesting all EURJPY 5M data that I have for 2013 and found some good results. 

The logic of this system is similar to what I use with my daily Hermes and weekly Daikoku low volatility breakout systems, in that we lookout for a period of low volatility and trade the breakout.

The following diagram is the sort of price movement that we'd expect in a ranging market. Of particular importance is the fact that the short-term moving average will usually hover in the middle of this range. 


The big money is responsible for price movement. When a market is ranging, the big money is accumulating positions, but we usually don't know in which direction until it's too late, after the range is already broken. Also, we can't simply place pending orders outside of the range and trade every apparent breakout as many will be fake or simply a bit of noise. So we need to look for something that's more 'pre-emptive'. I thought volume analysis would help, but so far haven't found anything I could really use.

So how do we pre-emptively detect the break of a range? Remember that the market is an auction market, with buyers and sellers bidding their wares. Once price approaches a level they like, buyers enter the market and bid against each other for supply, driving price up (vice versa for sellers).


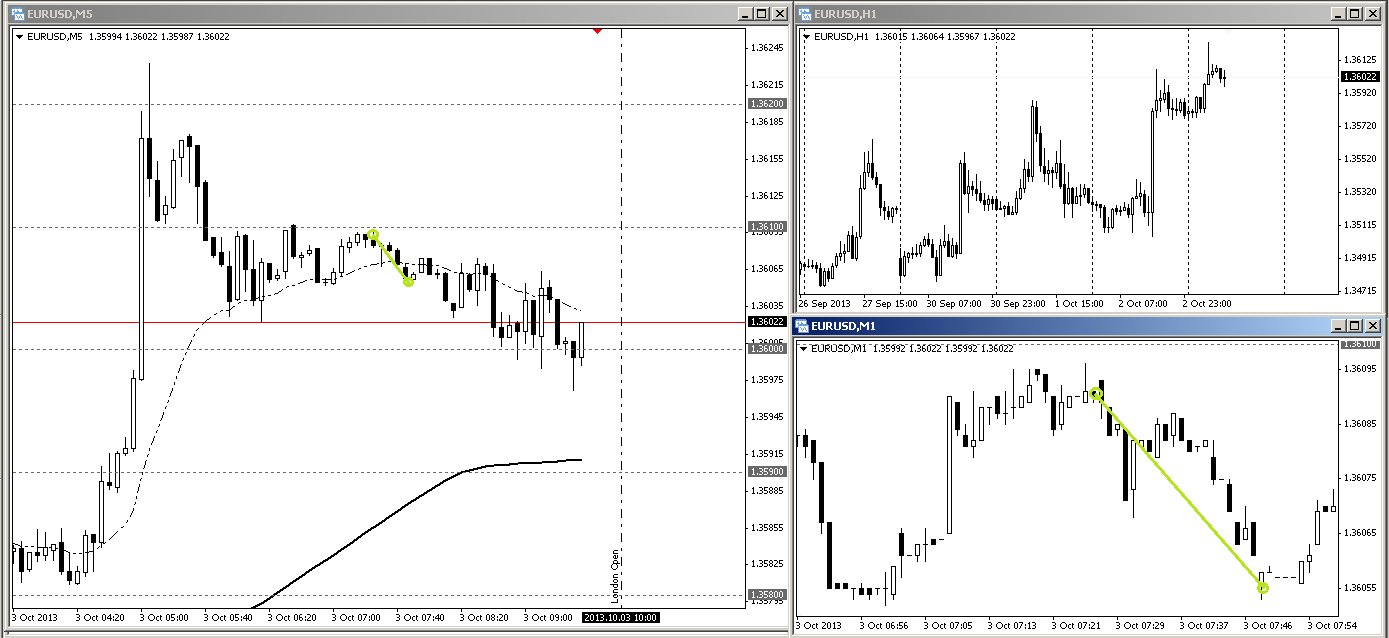
A ranging market ends when buyers run out of supply to buy, resulting in a bullish breakout. How do we detect this? Just prior to the bullish breakout, we can observe the final exhaustion of supply on our chart, as shown below:


Note where the point of exhaustion is relative to the moving average. We have a good probability that sellers are exhausted if the market turns upwards ABOVE the moving average. If the market had turned upward below the moving average, then it's more likely that we are still in a ranging market. 

So how do we turn this into a rule-based system? These are the MT4 indicators I used for my backtest:

- 35 EMA
- 14 ADX
- Fractals (under Bill Williams)

The 35 EMA is what we use for our moving average. We use 14 ADX to determine whether the market is ranging or trending. When ADX is less than 20, the market is ranging. 

We look for a setup as follows, where a retracement occurs within a range without touching the 35 EMA (this shows that buyers have bid the price up and sellers are running out of supply). The retracement must have an ADX of less than 20, otherwise we've missed the move.


That's about as much detail as I'd like to get into. These setups don't occur that frequently, perhaps once a day on the 5M chart. These setups seem to work best during the Tokyo and London sessions, unsurprisingly. It fails during NY. 

A reward:risk ratio of 0.75:1 seems to work best. Based on a sample size of 144 trades, my profit factor was 1.55. For a 5M system, I think this is remarkably good, considering just how much transaction costs eat up your profit. 

This is the equity curve I ended up with, using 2% risk per trade.


It's not  the smoothest equity curve, but for something on the 5M chart, I'm surprised I finally found something that might work. The next step would be testing this logic on other pairs. 

Sunday, October 20, 2013

Week in Review: 14th October to 20th October 2013

I only opened one trade this week. Bagged a win on the NZDUSD using my Cersenus system.


System Development

I didn't have much luck on my weekly two-bar engulfing backtest. It provided profitable results (profit factor approximated 1.2), but it was too low for what I desired from a weekly timeframe system. 

I've spent the last few days working on a 5M EURJPY trading system. Will post any interesting results.

Upcoming Signals

Traders should be aware of the low volatility last Friday. I see two signals that I like, using my Hermes system: the USDCAD and NZDJPY.


Gold and silver are also signalling a reversal on the weekly chart. My preference would be to long gold, using my Set system.


Monday, October 14, 2013

Prototype system: two-bar engulfing

I spent today developing and backtesting a system on the weekly charts. So far the results look okay. I've only tested four pairs from 2001-2012 (USDJPY, EURJPY, GBPJPY, AUDJPY). It's based on a candlestick pattern that I thought of while scalping last week. 

We look for a candle whose body and tail engulfs the body of the previous two candles, as illustrated below.


Every week, the market gives a 'verdict' on a currency pair. This verdict is the difference between open and close prices, and can be visually seen as the body of a candle. When we have a new verdict that overwhelms the previous two weeks, it represents a resounding  shift in opinion and we trade in the new direction. 

That's the logic, anyway. Using an inverted reward:risk ratio of 0.25:1, my profit factor is roughly 1.32, although other R:R ratios are also profitable. Sample size is currently 180. I still have at least 10 other pairs to backtest, and hope to finish by this weekend.  


Sunday, October 13, 2013

Re-optimising systems to IC Markets

I haven't been successful in my attempts at scalping for the past few weeks. It is the devil of trading. I'll continue to attack this challenge during my spare time, but I want to refocus my energy on what I'm good at - designing mechanical swing trading systems. But I've also learnt a few useful lessons.

1) Different pairs behave differently between sessions. The EURJPY seems to possess the most consistent volatility between different trading sessions (Tokyo, London, New York). European-focused pairs such as the EURUSD and EURGBP, on the otherhand, experience more dramatic changes in volatility as sessions change or overlap.

2) The lower timeframes can benefit from higher timeframe technical analysis. This is something that you can't do with higher timeframes. For example, if I trade the 5M timeframe, I can benefit from 1H, 4H and daily TF technical analysis. However, if I trade the daily or weekly timeframes, I can't really use the monthly or yearly charts since these are shaped by fundamentals, not technicals. This is a possible source of edge for lower timeframes. 

But now that I'm using a commission-based broker, I need to tweak my current systems a little bit.

UPCOMING SIGNALS

I only see one trade that looks interesting, a pinbar on the weekly NZDUSD chart.


I'll be aiming for a reward of 0.25R, based on my Cernesus system. 

Wednesday, October 9, 2013

9th October 2013: Trade #1


Net pips won = 3.2 pips - 0.55 pips = 2.65 pips won

I spotted good confluence here: a (fat) bullish pinbar with good volume, support at 1.32000, a trend line and Fib 50% retracement. I entered after the fat pinbar had closed and retraced a little. However, price seemed to find near-term resistance at 1.32100. After this level was respected three times, and with the trend line looking close to being broken, I decided to bail and took profit. I was aiming for 1.32160.

Tuesday, October 8, 2013

8th October 2013: Trade #3


Net pips won = 4.5 pips - 0.55 pips = 3.95 pips won

When I saw the bearish candle, I felt that the resistance level at 132.000 would be respected for at least one more time. I went short halfway up the bearish candle, and took profit just above the 50% retracement of the most recent bull move. Reward was 1.5R.

8th October 2013: Trade #2


Net pips won = 4.1 pips - 0.55 pips = 3.55 pips

I saw two bullish pinbars in favour of the trend and along the 50-61.8% retracement level of the previous move. There was also a good trend line that had formed. I missed out on the big move but felt wary of the resistance level at 131.850. My reward was 1.5R. 

8th October 2013: Trade #1


Net profit = 4.6 pips - 0.55 pips = 4.05 pips

This was a contrarian trade. When I saw five bullish candles were followed by a neutral doji, I felt this was a good shorting opportunity and went for a 1:1 R:R scalp.

Volume-range analysis findings

I backtested my volume-range analysis idea on 13 months of 1H data on the EURJPY and didn't find a reliable edge. I was looking for pinbars that had a smaller range and a higher volume, on the assumption that the big money was entering the market and absorbing short-term momentum. My profit factor was 0.97, using a R:R of 1:1. This was after gathering 233 samples. I based my entry on the break of the pinbar, with my stop loss on the long end of the pinbar.

So basically the idea was a coin toss. Not that this is a bad sign. My backtest was 'dumb', but if we take the chart's context into account (e.g. support/resistance, fib levels), I think it's possible to create an edge.

Sunday, October 6, 2013

Volume-Range analysis and pinbars

I've spent this weekend backtesting some ideas on volume-range analysis. I made a few systems that seemed nominally profitable, but ended up being killed by transaction costs. On the 5M timeframe, I just cannot find a way of beating transaction costs. They eat too much of your profit, and significantly add to your losses.

I've had better luck on the 1H chart, however, especially with pinbars. A pinbar that has a smaller range and greater volume looks to be a strong reversal signal, especially on the hourly chart. Here's an example.


In the above chart, we can see that the range of each marked pinbar is smaller than the preceding candle (indicated by the falling black line in the bottom indicator) and greater volume (the green bar in the bottom indicator). They usually herald a change in price direction as the big money moves in.

My sample size is only 25, but so far the results are looking good. I hope to post my findings later this week. 

Friday, October 4, 2013

Volume-Range Analysis

I spent this afternoon doing some chart analysis on the EURJPY. One of EURJPY's unique characteristics is its relatively consistent volatility throughout the Tokyo, London and NY sessions. This can make any fluctuations in volume and candle range more meaningful than other pairs. 

I combined the Volumes indicator with an Average True Range (1) indicator on the bottom of my chart. What we are looking for are significant drops in ATR accompanied with a simultaneous jump in volume. The Volumes indicator in MT4 measures tick volume, not trade volume. Since the spot forex market has no central exchange, there is no way to measure trade volume. However, we can use tick volume as a proxy.

Why are we looking for a simultaneous drop in ATR(1) and rise in tick volume? The big money typically moves the market. When the big money accumulates a position, it wants to avoid moving the market against it. When we see a drop in ATR(1) and a jump in tick volume, this is a good sign that the big money is entering the market, usually against the short-term trend. For example, if the big money wants to accumulate longs without moving price against it, it'll enter during a short-term bear trend. Volatility drops as the big money begins to absorb the short-term bears. Its presence is detected by the jump in tick volume. Once that liquidity is fully absorbed and short sellers are out of the market, we then begin to see significant bullish movement, with the big money sitting on longs. 

This was today's chart. I marked positions where we saw a significant drop in a candle's ATR, accompanied by a simultaneous rise in tick volume. As you can see, such events usually (but not always) precedes significant movement.  


4th October 2013: Trade #1


SL = 7.1 pips
TP = 7 pips
Transaction cost = 0.55 pips

Net loss = -7.1 - 0.55 pips = -7.65 pips

This trade was originally intended as a long scalp. As you could see, higher lows and higher highs were being made during the Asian session. The higher lows were interesting, as they signified a buyer's auction market, where buyers were bidding up prices as the supply of EURUSD became depleted. I anticipated that the big money was accumulating longs for the European session. When I saw a high volume, bullish engulfing bar, I decided to buy here. 

I had originally set a 5 pip TP. While price did edge up to my TP, it got thwarted every time it got close. However, there seemed to be maniacal support around 1.3623, which kept me in the trade (my original SL was at 1.3621). Every time price hit these levels, volume would shoot up and we'd see a rejection. Again, this told me that the big money were buying and I should remain long. If we look towards resistance at 1.36300, there didn't seem to be a real defence of this resistance level. Instead, we see volume drop, as if the bulls intentionally surrendered. Again, this convinced me that the big money is bullish, and perhaps they were setting up a trap for bears, or wanted price to fall so they can re-accumulate longs at a better price.

Eventually the London open came. I moved my TP and SL to 7 pips to account for the extra volatility but the open took my SL out. I'm not bearish. I do believe the European session will be bullish, based on the price action I've seen during the Asian session. 

I don't think I'll do any more trading today. Got my teeth knocked out too many times. But, this volume analysis has made chart-watching more interesting. I'd like to see if my bullish prediction will hold. 

4th October 2013: Thoughts and themes for today

With Friday's NFP cancelled, it looks like there'll be no major news events today. 

Being Friday, we can expect intra-week traders to close their positions before the weekend. Intra-day traders may also be exiting earlier than usual. Avoid trading retracements during the latter half of today as we probably won't see traders re-entering. Counter-trend trading may have a stronger edge today. 

Thursday, October 3, 2013

October 3rd 2013: Trades #3 to #7 and Summary

Well, the European session ripped my face off today. After experiencing a breakeven trade, followed by four losses in a row, I got so angry I turned my computer off and went for a half hour walk. :)

Today's European session was horrible, with it being less volatile than the Tokyo session (at least until the release of US non-manufacturing PMI). 

Materially, I wasn't affected. I'm using a micro account while I scalp and each losing trade only costs me a few bucks. At least my tuition costs are being controlled.

Trade #3 = 0.6 - 0.55 = 0.05 pips won

Trade #4 = -2 - 0.55 = -2.55 pips lost

Trade #5 = -2.1 - 0.55 = -2.65 pips lost

Trade #6 = -2.1 - 0.55 = -2.65 pips lost

Trade #7 = -4.5 - 0.55 = -5.05 pips lost

Summary

In total, I surrendered 12.35 pips today. I think my main difficulty with the European (and US session) is how to handle news releases. Early in the European session, bad Spanish services PMI figures came out, followed by good Italian services PMI figures. I guess this mix of good and bad news made it difficult to read the direction of the EURUSD.  

3rd October 2013: Trade #2


Win / Lose = Lose
SL = 2 pips
TP = 4 pips
Reward / Risk = 2
Transaction cost = 0.55 pips

Net loss = -2 - 0.55 = -2.55 pips

I saw a tiny, low-volatility candle on the M5 chart along 1.36000, which looked to act as near-term support. 1.36000 broke by about 4 pips, taking out my stop loss.

Looking at the chart now, I can see that price had begun to travel along a slightly bearish channel, with lower highs and lower lows. I should avoid trading against near-term momentum.


3rd October 2013: Trade #1


Win / Lose = Win
SL = 1.6 pips
TP = 3.6 pips
Reward / Risk = 2.25
Transaction cost = 0.55 pips

Net profit = 3.6 - 0.55 = 3.05 pips

Near-term resistance had formed along 1.36100. When I saw that price action stalled on both the M5 and M1 charts, I went short. I set my TP near the most-recent swing low. 

I'm not including spread in my transaction cost, otherwise I think it'll be "double-counted". Spread cost should already be reflected in my closing price. 

What pairs are the cheapest to trade during the Asian session?

As per the title. Some daytraders may have no choice but to trade the Asian session, perhaps because of work or convenience. So which pair is the "cheapest" to trade during Tokyo hours? I sourced volatility information from here and used transaction costs from my broker. Basically we're looking for the most volatility at cheapest cost.


It shouldn't come as a surprise to find that the JPY pairs tend to be the cheapest during the Asian session. The EURJPY costs more than the USDJPY, but you're getting more bang (or volatility) for your buck. 

How does this compare with the London session?


As expected, the EURUSD is the cheapest pair to trade. We also get 35% more volatility per pip spent.

If you want to daytrade during the Asian session, it looks like the EURJPY is your best bet. However, this doesn't take into account your particular trading style or edge. The more-expensive pairs may be suitable if you possess a particular edge for those pairs (e.g. if you're skilled at fading ranges, perhaps the European pairs may be better than the JPY pairs).

Wednesday, October 2, 2013

2nd October 2013: Summary

Trade #1: +4.9 pips
Trade #2: -1.9 pips
Trade #3: -0.9 pips
Trade #4: -3.4 pips
Trade #5: +0.5 pips

Net pips = -0.8 pips

I guess it shows just how crucial transaction costs are to your success. If I omit transactions costs (5 * 0.7 = 3.5 pips), I'd be up 2.7 pips today. 

Lessons:

+ Be wary of range-trading during London session
+ Consider exiting trades if price doesn't move in your favour after two candles 

2nd October 2013: Trade #5


Original SL = 3.3 pips
Original TP = 9.8 pips
Reward / Risk = 3
Transaction costs = 0.7 pips

Final TP = 1.2 pips

Net profit = 1.2 - 0.7 = 0.5 pips

This trade finished in minor profit. I saw a pinbar in favour of the short-term trend and went short at around the 40% level of the pinbar. Price then stalled for three candles (15 minutes). There was no breakout so I closed with a minor profit of 0.5 pips. Price reversed shortly after.

2nd October 2013: Trade #4


Original SL = 1.9 pips
Original TP = 8.1 pips
Reward / Risk = 4.26
Transaction costs = 0.7 pips

Final SL = 2.7 pips (due to slippage)

Net loss = -2.7 - 0.7 = -3.4 pips

This was a bad trade. I attempted to fade out a range. Being the European session, this was the wrong course of action. We should be looking for breakouts. My stop loss suffered 0.8 pips in slippage, so I ended up losing 3.4 pips in total. 

2nd October 2013: Trade #3


Original SL = 2 pips
Original TP = 6 pips
Reward / Risk = 3
Transaction costs = 0.7 pips

Final SL = 0.2 pips (due to slippage)

Net loss = -0.2 - 0.7 = -0.9 pips

This trade took place a few seconds after the London open and Spanish unemployment figures came out. Spanish unemployment increased by 25k rather than the predicted 12k. The news was bearish. I then checked where price was, relative to the range that had formed during the Asian session. Price was right towards the bottom of the range. To me this looked like a no-brainer, and predicted that news traders would go short and take out the stop losses just below the range, trapping longs and triggering a bear run. I promptly went short with a default SL of 2 pips. This was a tight SL for the European session, but I literally had no time to type in a carefully-considered stop loss, so used my default 2 pip stop loss. I set my initial profit target at 1.35100, 6 pips away, so my initial reward was 3R. 

Knowing how choppy news releases can be, I moved my SL to breakeven + 0.1 pip once the downward move was underway. The choppiness took me out, and I endured 0.3 pip slippage, resulting in a -0.2 pip loss. 

Price resumed its downward movement a few candles later.


What I'm curious about is why did price retrace significantly after the news release and take me out? Perhaps the longer-term EURUSD traders revealed their hand and used this opportunity to accumulate some cheap longs? Support at 1.3507 looks to have held so there looks to be significant bull support. 


2nd October 2013: Themes for today

- US govt shutdown should be priced in by now. The nearest variable now is when the shutdown will end. Bearish pressure on USD should be over as short-sellers begin to take profit?

- Today's London open will coincide with the release of Spanish unemployment figures. Expect volatility to dry up perhaps 20 minutes before the London open. London open should be more volatile than usual. 

- ECB interest rate decision and conference, US unemployment figures to be released within a window of 45 minutes around the NY open. The NY / London overlap should be very volatile and possibly whip-sawish due to pressure from both EUR and USD sides. If US figures are good, expect very strong USD rally as bears trading the US govt shutdown are stopped out?

2nd October 2013: Trade #2


SL = 1.2 pips
TP = 6.1 pips
Reward / Risk = 5.1
Transaction costs = 0.7 pips

Net loss = -1.2 - 0.7 = -1.9 pips

This trade didn't pan out. Being the Asian session, the EURUSD normally likes to range and I saw a good candidate for a reversal when I saw two candles respecting a near-term resistance level, with both candles being a pinbar and inside bar (albeit with a bullish close). There was also confluence with a longer-term trend line. I sold right near the top which allowed me to use a tight stop loss (1.2 pips). Price stayed stuck around here for the next 15-20 minutes, and as you can see, eventually took out my SL and broke out upward.

The duration of this "sticky" period around resistance got me thinking. Normally, if my trade was to work, we would see sell limit orders being triggered and longs taking profit. It shouldn't take long to soak up the liquidity at this resistance level, and we'd see a reasonably quick reversal downward.

However, we didn't see that. Instead, we saw the profit-taking and short-selling being absorbed quite happily. This would suggest that buyers with bigger pockets were entering the market to counter-act this bearish pressure. A time stop would've been good here. 

2nd October 2013: Trade #1


Original SL = 1.6 pips
Final TP = 5.6 pips
Reward / Risk = 3.5
Transaction costs = 0.7 pips

Net profit = 5.6 - 0.7 = 4.9 pips

I felt the above setup presented a good asymmetrical opportunity to trade with the trend, especially after two small, neutral-ish candles appeared. My stop loss was tight as I entered near the top of the turn. The market was either going to turn downward here, or shoot up. I originally aimed for 4R, but took profit at 3.5R when the downward price movement stalled for five minutes (refer to M1 chart in bottom right). Why risk 3.5R for an additional 0.5R?  

Tuesday, October 1, 2013

A few random thoughts on scalping / daytrading

I was thinking of starting a new blog dedicated to daytrading / scalping. Should I? The process of setting up another blog is tedious. On the otherhand, I know some readers are interested in my development and thoughts in swing trading, and mixing my entries with scalps may make the blog a little messy. However, it's been a decision that I've been considering for some time.

Why am I scalping (or daytrading)? I stumbled on this blog a few weeks ago (Forex Alchemy) and was quite impressed by the trader's simple methodology. Scalping is also what I consider "true" trading, in that you really develop a feel for the market, keeping abreast of current events and how they affect the market, minute by minute. I'm not saying that other forms of trading are "wrong". Any form of trading that generates money is good trading. However, scalping forces you to stare at the chart for hours and connect with the ebb and flow of price action. You begin to think of your opponents and how they will react to certain levels or situations. It becomes less mechanical, and more strategic. I find it very intellectually stimulating.