Friday, January 24, 2014

Week in Review: 20th January to 26th January 2014

It's been a good week. I opened nine trades, of which seven hit their profit targets, one hit its stop loss, and I exited the last trade at breakeven (which was a bad mistake). I'll post a few example trades...

GBPCAD - 21st January 2014

I saw a low volatility candle on the close of 20th Jan, and went long on the break of the candle's high on the 21st. Low volatility will usually be followed by high volatility, as we can see here. I took profit early, using a 0.5:1 reward : risk ratio as according to the rules of my Hermes trading system. This meant I missed out on the bullish breakout on the 22nd. You have to stick to your rules, no matter what.


Silver - 22nd January 2014

I opened two trades on silver this week. Spotted low volatility on the close of the 22nd, and went short on the break of the low. Price came within one pip of my profit target before it reversed and took out my stop loss.

When my short failed, I went long and banked some profit. Here's how I managed the long trade.


Both trades were based on my Hermes trading system.

Other thoughts

I also had a trade open on the GBPNZD using my Cernenus system, but I prematurely closed it out of fear. It went on to hit my intended profit target, so I missed out. A trader needs to follow his rules religiously and keep his emotions in check. This particular trade was on the weekly timeframe, which I think is a weakness of mine. It had been open for over three days before I closed it. The longer a trade stays open, the more opportunities there are to deviate from your rules. 

Wednesday, January 22, 2014

What's been going on lately...

I backtested the shaved bar system on the GBPUSD for 2013, which yielded a negative result. Since I was backtesting the European session, I was hoping the GBPUSD to outperform the AUDJPY but it didn't work. I suspect that since this system trades large movements, it's more susceptible to macro-economic factors, and I guess 2013 was pretty bad.

At the moment I'm developing and backtesting a low volatility system that focuses on the London open and the London / NY overlap. Usually, the start of the London and the London / NY sessions are highly volatile. However, if both sessions open with extreme low volatility, this would suggest that buyers and sellers are in balance. Since this is the start of both sessions, the volume behind both sides of the market will be enormous, and it will only take a small imbalance for one side to give up or even flip and join the other side, resulting in a volatile breakout. That's the logic, anyway. I've tested the GBPUSD for 2010 and 2013 and the results are quite promising so far. But there's still so much to do. I'll post more details if the results continue to hold. 


Saturday, January 11, 2014

AUDJPY shaved candle system - swing and a miss...

I completed my backtest on the AUDJPY which ended dismally. The system performed well throughout 2010-2012, but then fell apart in late 2012 and throughout 2013.

I'm quite annoyed since the backtest started out so well, but then began to smack me in the face, time and time again, as I plowed through the home stretch. That's the nature of trading. 

My system is nominally profitable, but there's a steep decline in the equity curve in the last year (this is for all trades from 8AM-2PM GMT). 


Here's the equity curve if we trade against the trend. (I used RSI(14) to measure the trend, with RSI(14) > 50 suggesting a bullish trend, and RSI(14) < 50 suggesting a bearish trend).


The drawdown isn't so bad. 

TIME ANALYSIS

Hour / Market session

I found a few interesting results when I sorted my trades by time. Here are my results sorted by hour:


Here's the same information as a bar chart:


We can see that the shaved candle signal performs best during the European session, which I found surprising, being the AUDJPY. I had hoped that this would perform best during Asian / Australian trading hours but I guess not.

Weekday

Here are the results for each weekday.


I'm not sure if this information is particularly useful. I expected Monday to perform poorly since Mondays traditionally tend to be quiet, but I also expected Friday to perform poorly for the same reason as well. 

Conclusion

This isn't a system. But what I have learned is that the European session seems to be best for intra-day trades. My next plan is to test the EURUSD during 08:00 to 14:00 GMT. Because I'm only testing six hours per day, this backtest should be alot quicker than the AUDJPY. I would especially like to see how large shaved candles perform when going against the trend.

Saturday, January 4, 2014

AUDJPY: Shaved candle system - influence of time

Following on from this post.

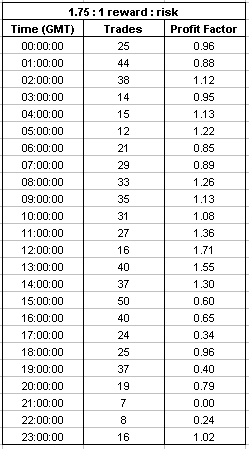
I spent some more time on my backtest, and sorted my trades by the hour. This is what I came up with.


You can see that the profit factor exceeds 1 between 08:00 GMT and 14:00 GMT. This roughly covers the Tokyo / London overlap, the London session and the first half of the London / NY overlap. The system tanks towards the end of the London / NY overlap (traders leaving the market, I guess) and the NY session itself. During the Asian session, the system seems to be at breakeven, which I found surprising. I had expected better performance. 

I've tested 15 months worth of data, and have 30 more months left. I'm doing the backtest manually, as in analysing every candle on the 1H chart. It's very time consuming. I don't expect my backtest to finish until mid-January, at this rate. However, my sample size is big enough to make me confident to forward-test this system live (with minimum risk, of course). 

Trade idea: exploiting the EURCHF peg

Last night, I was thinking about George Soros, the infamous man who "broke the Bank of England" and the reasons why the BOE lost against Soros. Long story short, the BOE pegged the British pound to the German Duetsche mark in the early 90s, even though the economies of both countries were heading in opposite directions at the time (UK was in recession while Germany was growing). The peg couldn't be maintained as investors and speculators shorted the absolute crap out of the British pound, and the BOE simply ran out of foreign reserves to buy and defend the British pound. 

Now what was special about this situation that allowed George Soros to bank over a billion dollars in profit? It was the peg. I realised that pegs can provide a near risk-free opportunity to make some profitable trades, depending on the nature of the peg. 

The Swiss central bank (SNB) has currently pegged the Swiss franc (CHF) to the euro, setting a floor price of 1.20000. This can be seen in the charts from 2012, when the SNB began supporting the CHF between April and August 2012.


The SNB's defence of 1.20000 provided opportunities to buy the EURCHF with near zero risk. If you bought at 1.20000 with a 10 pip stop loss at 1.19900, your stop loss would never get hit (as long as the peg existed). All you had to do was wait for the euro to eventually appreciate and bank your near risk-free profit.

Suppose we did take this trade, and bought EURCHF at 1.20000 with an ultra-tight 10 pip stop loss. The EURCHF peaked at  1.26500 in May 2013, 650 pips away from our purchase price of 1.20000. Our return would have been 65R. And remember this was with little risk, courtesy of the Swiss central bank. 


This isn't quite the same level as Soros, but the reward vs risk was still very asymmetric, in favour of reward. The main risk was the SNB de-pegging the CHF. If the EURCHF ever finds its way near 1.20000 again, keep an eye out for this opportunity. It's not often a central bank is on your side.