Monday, December 31, 2012

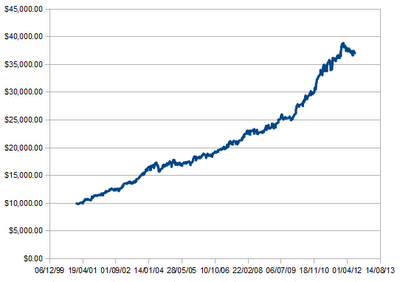
Presenting my brand spanking new "Daikoku" trading system

I've been quietly working on this trading system for a few weeks now. My first-round backtesting was finished today and the system is looking very profitable.
 
It's a low volatility breakout system, based on the weekly timeframe.
 
My backtest details:
 
Years tested: 2001 to mid 2012
Pairs tested: EURUSD, USDJPY, GBPUSD, AUDUSD, USDCAD, USDCHF, EURJPY, NZDUSD, GBPJPY, AUDJPY, NZDJPY
Timeframe: 1W
 
Sample trades collected: 403
Profit factor: 2.49
 
There are no indicators involved. I initially backtested using ATR to measure volatility, but didn't find it useful in this timeframe. I then merely measured changes in volatility by comparing the current week's range with the previous week. If it's less than 50%, we have an entry signal.
 
We look for entry signals over the weekend after the trading week is over. We then place pending orders that will last for all of next week.
 
Entry signal: At the close of the week, the week's range must be less than 50% of last week's range. On Monday morning when the markets open, we place a pending long at the high of the week + 1 pip, and a pending short on the low of the week - 1 pip. The orders should be set to expire at the end of next week.
 
Stop loss: If going long, the low of the week - 1 pip. If going short, the high of the week + 1 pip.
 
Take profit: 25% of your stop loss
 
Some people may raise their eye brows at the level of the take-profit. At this level, our reward-to-risk is 0.25:1, which is a little unconventional. But I cannot deny my backtest results. This is one of the best R:R ratios to use. All R:R ratios are profitable, but 0.25:1 R:R almost maximises my profit factor, up to 2.49, which I think is very good for a mechanical system with little optimisation.
 
Here's a graphical example of a trade:


Everything about this system is preliminary at the moment. I would like to further optimise but even at this stage, the system is tradable. My main concern is the relatively small sample size of 400 trades, although it has been tested 10+ years across all the majors and Yen crosses. The high profit factor makes this alluring.

Thursday, December 27, 2012

How the filthy rich handle drawdown

I'm halfway through reading Theo Paphitis' (BBC Dragons' Den) autobiography and noticed that the self-made ultra-rich have something in common. Almost all of them came perilously close to bankruptcy at some stage, usually early in their "career".
 
In trader parlance, you can say that their drawdown came close to 100%. In fact, many of these millionaires / billionaires took on astronomical levels of debt at the lowest point of their careers, so you can say that drawdown exceeded 100%.
 
Can traders learn something from this? Trading is just like any other business. You have suppliers and customers (both from the market), you buy low and you sell high, you use other people's money (OPM) via leveraging and you have overheads that you want to minimise (spread and overnight swap rates).
 
Quite often these self-made entrepreneurs would fully invest themselves in a single enterprise. That would be the equivalent of putting in 100% equity into a single trade. A big no-no.
 
So are entrepreneurs like Theo Paphitis and Richard Branson stupid? Did they fail to manage their risk? Or perhaps the risk they took fits their psychological profile?
 
I'm not saying I have the answers. But drawing a parallel between entrepreneurship and trading is interesting and I think valuable lessons can be gleaned from this.
 
To be fair, these entrepreneurs began to manage their risk better as their wealth accumulated. These days Richard Branson segregates each of his businesses into autonomous units so if one blows up, it doesn't affect his business empire. That's like risking 1% equity per trade. It's a very managable level of risk. Reading their biographies, you realise that many of these entrepeneurs were somewhat naive when first starting out and I guess got "lucky" when their 100% equity trade won. We don't read the biographies of those who lose everything.
 
The journey to wealth usually goes like this:
 
1) Risk big early on
2) Hit a home run or lose everything
3) Once you're rich enough, slow down and manage your risk
 
"Losing everything" isn't the end-all, be-all. I guess these entrepreneurs accepted such a possibility. As long as you have two hands and a brain, you can always regather some skin to get back into the game.
 
But no-one ever got filthy rich by being conservative. If you do play it safe, you may end up as a single-digit millionaire by retirement. It's not a bad position. But to get into the hundreds of millions and above as a self-made man, I don't think there's any way around taking large risks.

Saturday, December 22, 2012

The future: managing my own money, or other people's money?

I spent the last week having a good think about my future's direction. As a professional trader, I have two options:
 
1) Manage my own money
 
2) Manage other people's money
 
I've been reading CASHFLOW Quadrant from the Rich Dad Poor Dad series, and according to Robert Kiyosaki, most wealthy people obtain their wealth by utilising other people's money (OPM) and time (OTM).
 
If you're a professional trader / investor with a solid track record of profitability and low drawdown, investors will throw money at you. If you do decide to manage other people's money, your main source of income will come from fees. An advantage of managing OPM is scalability. There's not much difference in effort when investing $1m or $100m. Your investment or trading system(s) should be very similar in both cases. However, in the latter case, your income increases a hundred fold. Not bad at all. If you're a profitable trader using your own money, why not charge investors a fee to piggy-back on your success?
 
On the surface, this looks like an attractive proposition. But here are my reservations:
 
1) It becomes almost like a job. You're no longer answerable to yourself, but also to your investors. You'll be required to meet all sorts of regulations, expectations and KPIs. Most traders become so because of the freedom, and this sets you back in the corporate world, albeit you are your own boss.
 
2) Your psychological profile may mismatch with investors. Now, this can be partly remedied by being selective about those who invest with you. Most passive investors seek steady and reliable returns. In contrast, most traders want to strike it rich and retire as early as possible. Different goals. Many investors will balk at the prospect of losing 10-20% equity in a short-term drawdown, but traders know that such drawdowns are expected during long-term wealth creation.
 
There's prestige in finding your own hedge fund. Pyschologically, though, I don't think it's for me.

Sunday, December 16, 2012

Entry signal on XAUUSD

A low volatility candle has appeared on XAUUSD (gold) at Friday's close.


Wednesday, December 12, 2012

Win on NZDUSD, equity update

My trade on the NZDUSD resulted in a win. I used a 1.25:1 reward:risk ratio when trading with the trend.


Equity Update

Since going live at the start of September, my equity has grown by 5%. If annually-adjusted, that should mean a performance of 17% p.a.

I've used various levels of risk, from 1% to 5% per trade. I found 5% risk to be quite high, particularly for mechanical trading. I've reduced my last few trades to 1% risk or less and found it much more comfortable - in fact I forget I have trades open at this level. The key to winning mechanically = low risk * high frequency. It's the high frequency part I need to focus on.

Monday, December 10, 2012

Entry signal on NZDUSD, full-bodied candles

A low volatility candle appeared on the NZDUSD over the weekend. The NZDUSD is running into some resistance, so it will be interesting to see how this plays out.


Full-bodied candles
 
I'm currently backtesting a new system based on full-bodied candles. Essentially, the open and close of a full-bodied candle should occur within the top and bottom quarters of the candle. I'm building a database on the USDCHF which will also contain RSI(14), ATR(14) and ADX(14) values to see if there is any relationship between these variables and profitability.
 
I have noticed that full-bodied candles can be profitable when their range is between 100% and 150% of ATR(14), trading with the trend. The sample size was 100, from the USDCHF between 2001 and 2006. Our entry would be the break of the candle's high or low, and our stop loss would be the opposite end of the candle. With a 1.5-to-1 reward-to-risk, profit factor was 1.36, which is okay. The profit factor for all R:R ratios above 1 are also positive, so thus far this is looking promising. 

Thursday, December 6, 2012

Optimisation and simultaneous entry signals

One thing I noticed in my optimisation is the occurence of simultaneous entry signals.
 
Depending on your system, trading simultaneous entry signals may improve or detract the profitability of your system. If it does improve profitability, it can be problematic if you don't adjust your % risk per trade.
 
For example, suppose the current day ends and you see five juicy entry signals on different pairs eg. EURUSD, USDJPY, AUDUSD, NZDUSD, XAUUSD. Your backtest shows that it is favourable to trade every entry signal on the market. If we risk 2% of our equity per trade, we will end up risking 10% altogether if we take all five entry signals. Because we can expect some moderate correlation between all pairs, trading simultaneous signals usually ends up as an "either or" affair. We usually either win or lose all trades.
 
10% risk is high. Is there a way of being to trade all entry signals without excessive risk?
 
Here are our options...
 
Option 1 - Continue with the status quo and stack on the risk
 
We typically risk 2% equity per trade. If we see five entry signals, we trade all five and risk a total of 10% equity. If we see ten entry signals, we risk a total of 20% equity etc.
 
Option 2 - Split the risk among the trades
 
If we typically risk 2% per trade and see five entry signals, we may split that 2% among the five trades. In this case, we will risk 0.4% equity per trade.
 
Option 3 - Reduce our risk in general, stack on the risk when multiple entry signals appear
 
This is much more system-specific. If your backtest shows significant improvement in profitability when trading multiple simultaneous signals, wouldn't it make more sense to reduce your risk when you have a solitary entry signal? That way, should multiple signals appear, we can stack on the risk without it being too excessive.
 
Suppose we reduce our risk per trade to 1% when trading a solitary entry signal. Should five entry signals appear simultaneously, we can stack on this reduced level of risk. In this case, we will risk a total of 5% equity for these trades. While 5% risk is high, it isn't insanely high.
 
Option 4 - only trade the pair with the highest expectancy
 
Of the five pairs signalling an entry (EURUSD, USDJPY, AUDUSD, NZDUSD, XAUUSD), your backtest shows that the EURUSD has the highest expectancy. We may decide to trade the EURUSD only and ignore the rest.
 
My thoughts
 
There is obviously no "right" answer, although there are wrong answers. Blindly stacking on risk is a sure-fire way of busting your account when the stars align and the gods conspire against you in the perfect nightmare trade.
 
However, if there is a significant improvement in profitability from simultaneous entry signals, we want to make the most of this. Another way of looking at it is that we may see a decrease in profitability with solitary signals, hence we should risk smaller during these situations. When multiple signals appear, we ramp up the risk, but not too much. Some variant of Option 3 may be ideal, with perhaps a total risk limit of 5% or some other value.
 
Option 4 is straightforward. We trade as normal, but when multiple signals appear, we cherry-pick the best pair to trade from our backtest results. The danger stems from curve-fitting, although if our system is robust, this shouldn't be a real problem and we'll approach a result similar to our backtest.
 

Wednesday, December 5, 2012

Optimisation of Hermes

My optimisation of my "Hermes" low-volatility breakout system is proving to be very messy.
 
The trouble with optimisation is that you can take it in any direction. At the moment I added an RSI filter to check how the sytem performs when going with and against the trend.
 
There is a noticable improvement in profit factor when trading with the trend. I have also noticed that the system performs best against the trend if I use a Reward:Risk ratio greater than 2, while trading with the trend performs best with a Reward:risk ratio of less than 2.
 
I suppose this makes sense. If you are trading with the trend, the likelihood of running into the end of the trend is relatively high. On the otherhand, if you trade against the trend and the trend-reversal is strong, it can turn into a new trend and you succeeded in catching the beginning of this trend. This would explain the bigger pay-off if trading with a larger reward:risk ratio.
 
With that in mind, I have also noticed other behaviour that can be used to "optimise" my system further. For example, I have noticed that trades perform better when you have a multitude of entry signals on the same day. I guess the entry signals on different pairs reinforce each other. Trading only on days with multiple signals may improve my profit factor, but at what point does it end being an exercise in optimisation, and the start of curve-fitting?
 
To be safe, I may stick with one level of filtering only. I also feel that I'm getting sidetracked. Mechanical systems are not intended to be perfect. They should be "rough but ready", and ideally deployed as part of a portfolio of independent trading systems. To win mechanically, you should trade with a low risk per trade, and let high frequency and exponential growth do the heavy lifting. To do this, though, you'll need more systems to trade with. I'll return my attention to system development.

Monday, December 3, 2012

Recommended resources (Dec 2012)

Over the last year I've gathered a few sites / resources that I've found to be very useful. Some of my recommendations:
 
 
For anyone new to trading, I recommend BabyPip's "School of Pipsology". It's a FREE online course on basic trading. I've read a few introductory forex / trading books from bookshops, and found the School of Pipsology superior. The online community at BabyPips are also generally helpful.
 
 
Mercenary Trader covers trading in general, not just forex. It's main emphasis, in my opinion, is on trader psychology. Mercenary Trader routinely releases newsletters that I've found inspirational and insightful. I tend to ignore the market commentary, although that is available as well.
 
 
The owner of this blog / website, Daniel Fernandez, is a pure mechanical and automated trader. I'm a mechanical trader myself, and would like to become automated in the future. The site provides a free e-book which I can currently perusing. There's a noticable absence of quality information regarding automated mechanical trading. This site is one of those rare gems of expert knowledge that you'll find once in awhile.
 
 
I enjoy this website because I find the webmaster, Hugh Kimura, refreshingly honest and down-to-earth. I also believe that we're both at a similar level of development. The site doesn't contain much, strategy-wise, but it's most useful resources are the podcasts and interviews with professional traders. Getting an insight into the world of other traders is fascinating.
 
 
My forex broker. I used to be with GoMarkets but found the spreads on Pepperstone to be much better. Many Australian traders seem to prefer Pepperstone. I've been with them for half a year and haven't encountered any critical problems so far.

Thursday, November 29, 2012

An interesting few days...

EURUSD

Monday provided a gush of low-volatility entry signals on the EURUSD, NZDUSD, gold and silver.
 
I decided to trade the EURUSD, being the most liquid, and both a long and short were triggered on the break of Monday's high and low.


I initially aimed for a 1.75:1 reward:risk ratio. As you may see, my long didn't go far before I was stopped out. Price broke downwards and after triggering my short, I began to lose confidence about my trading plan and closed my trade with a reward:risk ratio of 0.3:1.
 
Price continued to move down and would've hit my initial profit target. It then reversed, producing a bullish pinbar this morning.
 
The main lesson here is psychological. If I had maintained my faith, I would be in the green right now. My trading plan is complete. I just need to stick with it. Trading is 10% technique, 90% psychology.

Sunday, November 25, 2012

Review of November trades

As of the 25th of November, I've taken four trades for the month. Two were losers, while two were winners. Overall, my account is up ~4% for the month, give or take (it's hard to calculate since I am always injecting equity from my day job, obscuring the growth of my equity curve).
 
GBPUSD - 7th November 2012
 
I saw a low volatility candle on the GBPUSD at the end of 6th November, and laid out my pending long and short at the break of the candle's high and low, respectively. Both the long and short were triggered on the 7th November. Sadly, price whip-sawed for the next few days, stopping out both my orders. I was aiming for a 1.75:1 reward:risk.


XAUUSD, NZDUSD - 23rd November 2012
 
There were two low volatility candles that caught my interest during the 22nd November. They were on the XAUUSD (gold) and NZDUSD. There was an additional signal on the XAGUSD (silver), but due to extreme correlation with gold, I decided to skip the silver signal.


Gold:


NZDUSD:


As you can see, the high of both low volatility candles were broken, triggering a long. My reward:risk was set at 1.75:1, which was easily hit. I walked away with two winners. Since my reward:risk is bigger than 1:1, I am ahead for the month.
 
My main concern was the possibly strong correlation between NZDUSD and the precious metals. NZDUSD is a commodity dollar, although I don't believe New Zealand is a big exporter of gold, unlike Australia.
 
Miscellaneous news
 
I'm currently optimising my "Hermes" low volatility breakout system, the system my previous four trades are based on. I'm testing to see what happens if I try to trade with higher values of ATR, up to 67%. I'm also testing an RSI(14) filter to see whether trading with the trend can be advantageous. Results are too early to tell at this point.

Saturday, November 17, 2012

Monday breakout backtest is a bust...

I took a break from trading last week and resumed my Monday breakout backtest a few days ago.
 
Results are no longer rosy. I continued my backtest on the AUDUSD from 2004 to 2006, which yielded significant drawdown. I also tested the EURUSD in 2012. With a 2:1 reward:risk ratio and 50% *ATR(14) SL, my profit factor was 0.61. Very poor.
 
Of course, this gives rise to the possibility of a mid-week "Wedneday Reversal" which may be exploitable....

Thursday, November 8, 2012

Results so far so good on Monday breakouts...

My preliminary backtest on the EURUSD passed. I gathered 171 sample trades from 2001 to mid-2004. You set a pending long and short each Tuesday. Entry is the break of Monday's high or low. SL is ATR(14) * 0.5.
 
After 171 samples, all R:R above 1:1 showed a positive profit factor, which is healthy. Good Reward:Risk seem to be 2:1 and above. With 2.5:1, profit factor was 1.44, which is very good for a mechanical system.

I've started testing the AUDUSD. If that passes after 100-200 samples, I'll focus on the USDJPY.

General rule: don't talk shop with non-traders?

I generally spend 4+ hours per day doing something trade-related, whether it be research, backtesting, reading or setting up orders. So understandably it's something I enjoy talking about.
 
There's a peril with talking shop with non-traders, though. They usually have a different understanding of the market than you do.
 
When I put on a trade, I try to think in terms of profit factor. Every trade I put on, I win the amount I risk * profit factor, regardless of whether I actually win or lose. It's the long run that matters, and with a thoroughly tested system, your long-term result should be similar to your backtest result.
 
The peril lies when you speak about losses to non-traders. No-one likes losing, but traders (should) understand that a loss is nothing more than an overhead. As long as you're profitable overall, losses should be regarded as a cost of business.
 
Non-traders usually don't understand this, though. When you speak about losses, they may project their own beliefs onto you, e.g. "no-one can beat the market", "the market is rigged", "you'll never win" etc. This is toxic stuff.
 
There's a similar danger when you speak about winners. Non-traders may come to see you as some sort of "guru" who can't possibly fail. Their projection can feed your ego, and make the inevitable loss difficult to accept.
 
And then of course, you will meet individuals who disagree with capitalism, trading and speculation altogether.
 
When conversing with non-traders, it's probably best to be light on the details and protect yourself from outside projections.
 
(and yes, I suffered a loss on the GBPUSD today!)
 
Monday breakouts
 
Spent some time today backtesting the break the Monday's highs and lows. So far I've tested the EURUSD from 2001 to late 2002. Only 81 samples have been collected, but with a stop loss of 0.5 * ATR(14) and a reward-to-risk ratio of 2.5:1, profit factor is 1.32. It's enough to keep me interested in continuing my backtest.

Wednesday, November 7, 2012

Latest developments...

- A few days ago I decided to daytrade using price action. I knew what I was getting into and only traded single microlot orders. It confirmed my distaste for price action - it is overwhelmingly subjective and I found myself able to draw support & resistance lines anywhere on the chart to justify any price action "signal". I entered three trades - closed two at BE, lost the other one.
 
- Backtested the low-volatility Hermes trading system on the AUDJPY from 2001 to 2012 (it passed).
 
- Now this is probably the most significant breakthrough in the last few weeks. I analysed my entries based on the low-volatility Hermes system, and found that half of my entries were triggered on Tuesdays, meaning Mondays tend to be lowly volatile. Well duh. Mondays tend to 30% less volatile than the other weekdays. I think it's highly possible to design a new trading system based on the breaks of Monday highs and lows. The break of a Monday high or low may set the intra-week trend. I'll do a preliminary backtest to see what values pop up.

Saturday, November 3, 2012

Interesting setup on the USDCHF - 1HR chart

I was checking the charts, testing for confluence, and found this interesting setup on the USDCHF.

(you'll probably have to click on the image to see it more clearly)


This was a very good example of a high probability price action setup.

Wednesday, October 31, 2012

The problem with an infrequently-traded system...

... is that you lose touch with the market. A low-volatility candle appeared on the AUDJPY a few days ago.


If you tried to trade the break of both the high and low of the candle with anything greater than a 1:1 R:R, you would've been whip-sawed out.
 
(Un)fortunatelly, I decided to ignore the market that particular day and simply focused on my research and backtesting.
 
That is the trouble with an infrequently-traded system. If you're potentially waiting 2+ weeks for your next entry signal, you can forget that you're trading live. I feel very much as if I'm back in "demo mode".
 
I will notch this up as a lesson in trader psychology. As a trader, you have to understand your psychological profile, and I believe I'm one of those traders who needs to be in the market frequently to remain engaged.

Saturday, October 20, 2012

Little update - loose pinbar backtest

My preliminary backtest on my mechanical pinbar system showed a profit factor hovering between 1.15 and 1.3. This week, I decided to stress-test the system with the entirety of data I had for the EURUSD and NZDUSD from 2001 to 2012. 
 
My profit factor turned out to be a little less than 1.0. It was almost as if I was trading randomly. As to the discrepancy, I'm not sure how to explain it. I suppose you have a system, and it performs okay 90% of the time. However, it may hit a pocket of "bad luck" 10% of the time where consecutive trades fail. Random sampling may not pick up on these pockets, especially if the pockets and/or sampling is too small. Either that, or I was just lucky with my preliminary sampling.
 
I added an RSI(10) filter to measure the trend. Pinbars tend to behave as trend-reversal signals, but they can also act as trend-continuation signals, as seen below:


As you may see, my criteria for a "tradable" pinbar is very loose. I totally ignore the prominence of the pinbar's "nose" with regards to to the previous candle e.g. the noses of the very first and very last pinbars don't even break the previous day's low. The open and close of the candle must also occur only in the top or bottom 50% of the pinbar, which is also very loose. I'll explain more if my backtest continues to be positive.
 
Adding an RSI filter improved my results significantly. Here are the results, filtered with the RSI indicator. Basically if RSI(10)>50 and we have a bullish pinbar, we're trading with the trend. If the pinbar is bearish, we're against the trend. Vice versa when RSI(10)<50.


Trading with a 2:1 reward:risk seems best. I used an ATR(14) * 0.5 for my stop loss. As you can see, going against the trend was very bad. The backtest so far suggests a frequency of 1.5 signals a month per currency pair, which is very good (trading six pairs = 2 signals a week), and compensates for the relatively low profit factor.
 
The next step(s) is to test the other pairs, of course. This may take awhile. Any suggestions on improving this system are welcome.

Friday, October 19, 2012

If you want to be inspired...

... go on Youtube and look up "Shark Tank" or "Dragons Den". In these two shows, budding entrepeneurs pitch their business ideas to ultra-rich investors and venture capitalists. This is capitalism at its finest.


Thursday, October 11, 2012

Conclusion: EURGBP is driven by fundamentals

I spent an hour brewing over the EURGBP and I've concluded that price action on the EURGBP is driven mostly, or perhaps even purely, by fundamentals (by fundamentals, I mean factors outside the EURGBP chart). Some technical analysis will be useful, but a purely-technical trade will have difficulty on the EURGBP. I will explain why.
 
The EURGBP represents the difference between the EURUSD and GBPUSD. The EURUSD and GBPUSD make up 28% and 9% of the forex market, respectively. The EURGBP makes up 3%.
 
The combined market share of the EURUSD and GBPUSD is 37%. Technical traders on the EURUSD and GBPUSD overpower those on the EURGBP by a factor of over 10:1 (37% vs 3%). If I see two signals on the EURUSD and EURGBP, which one will most technical traders trade? Most likely the EURUSD. The technical signal on the EURGBP will be overshadowed by the signal on the EURUSD. Any technical trader on the EURGBP will be a fart in the wind.
 
This is a very simplistic argument, but I hope to illustrate the principle I thought of. The technical side of the EURGBP will mostly be found on the EURUSD and GBPUSD. The EURGBP just measures the difference between the two pairs and shouldn't be traded on technicals.

Backtest on USDJPY and EURGBP complete, thoughts on EURGBP

I just finished gathering 200 more "pinbar" samples from the USDJPY and EURGBP. The USDJPY passed fine, but the system got completely annihilated on the EURGBP. Profit factor ranged from 1.0 to 0.5 with all reward:risk ratios up to 5:1. Above that, the system becomes profitable.
 
Half of Britain's exports go to Europe, according to this article. Generally, this should mean that the British and European economies will march in-step. Because of this high correlation, the EURGBP will tend to be range-friendly, or perhaps even whip-saw friendly (pinbars should be profitable in a ranging market if R:R is small enough, but I was getting stopped out so many times).
 
The EURGBP is somewhat liquid, making up 3% of all volume traded in the forex market.  Therefore the whip-sawish action isn't so much due to illiquidity, but perhaps more to do with Britain and Europe itself.
 
I suspect that the AUDNZD would follow similar behaviour, considering how tightly correlated both economies are (both economies are commodity export-driven and 23% of NZ's exports go to Australia).
 
I think there is something here to explore in future.

Pinbar backtest - 40% complete

I'm currently backtesting a mechanical system based on pinbars, but with my own modifications. Profit factor is hovering between 1.15 and 1.3 at the moment. I've only gathered 400 trades from four pairs so far (GBPUSD, EURUSD, AUDUSD, USDCHF) between 2001 and 2012. The goal is to gather 1,000 samples. What's making this system real juicy is the frequency of trades. If I trade the top 8 liquid pairs, the results suggest a frequency of 6-8 trades per week.

Saturday, October 6, 2012

Relationship between profit factor and risk per trade

I stumbled upon this discovery by accident.
 
As a general rule of thumb, traders risk 1-2% of their equity per trade to control their drawdown when they lose.
 
It's also another general rule of thumb that if you are using a trading system, you optimise the variables within the system to maximise your profit factor (within reason - if you over-optimise, you end up curve-fitting which has little predictive value).
 
Thus, we trade a system with maximum (or near-maximum) profit factor, and risk 1-2% of our equity per trade.
 
I will explain why this may in fact sub-optimal under certain conditions.
 
I was tinkering with my low-volatility breakout system "Hermes" and found that a reward:risk of 0.5:1 provided a better profit factor than reward:risk of 2:1 (1.49 versus 1.33, respectively). One of the trading mantras you'll find on the internet is "never trade below 2:1!", which is why I tended to disregard any R:R below 1:1.
 
Nevertheless, I decided to plot the equity curves for 2:1 and 0.5:1 R:R, at 1% equity risk per trade. Results are below.

Equity curve for 2-to-1 reward-to-risk, profit factor = 1.33, risking 1% equity per trade.


Equity curve for 0.5-to-1 reward-to-risk, profit factor = 1.49, risking 1% equity per trade.

 
As you can see, increasing my profit factor actually harmed the growth of my equity. What's going on!?
 
I spent two days scratching my head, re-checking my maths and wondering what the hell happened. These are two versions of the same system, so the number of trades hasn't changed at all. The only difference between the two system versions was my R:R and nothing else. The system with the higher profit factor should be growing faster, not the other way around.
 
I began to examine my % equity risked per trade, and thought about the Kelly criterion. The Kelly criterion provides a mathematical method of finding your optimal risk per trade. I decided to find the optimal risk level for 2:1 and 0.5:1 R:R, which turned out to be 11% and 28% if I remember correctly.
 
Thus, when my risk was at 1% (when I graphed my equity curve), my risk level is more optimal for 2:1 R:R than 0.5:1 R:R. 1% is closer to 11% than it is to 28%, and thus my equity would grow faster using a R:R of 2:1 than 0.5:1, despite having a lower profit factor.
 
That was a startling discovery, and something I've never read in any trading book so far. It goes to show why a serious trader must do his own homework rather than rely on hearsay from experts or the internet. I'm now wondering if professional traders are aware of this paradox?
 
Now, this dilemma can be solved quite easily if you base your equity risk per trade on some derivative of the Kelly criterion rather than an arbitrary rule like "2%", which is espoused in some trading books. For example, you may risk 10% of Kelly, in which case I would risk 1.1% per trade if I'm using a 2:1 R:R, and 2.8% if I'm using 0.5 R:R. In this case, 0.5 R:R will build equity quicker and all is well.
 
Important lessons:
 
1. Do your own homework
2. Question EVERYTHING, even if it comes from Dr. Alexander Elder (i.e. the 2% rule)
3. Use context-sensitive, self-adjusting rules rather than hard, arbitrary rules

Monday, October 1, 2012

Missed out on a winner - "Hermes"

I missed an entry on the USDJPY due to a mental miscalculation. The range on the USDJPY was 17 pips on the 27th of September, less than 50% of ATR(14). However, I did a quick mental calculation and thought it was 27 pips and ignored the entry signal.


If I did trade this, the low of the entry signal bar would've broke and trigger a short, resulting in a loss. However, price rebounded and broke the high. A long with a 2-to-1 risk-reward would finish in profit today.
 
The lesson here? I need to learn how to program indicators in MT4! And to be less careless with my mental arithmetic.

Friday, September 28, 2012

Win on USDJPY - "Hermes"

I've conducted four trades using the "Hermes" system so far - two wins and two losses. This is an entry on my latest trade.


Over the weekend I identified an entry signal on the USDJPY, and put in a pending long and short. The short was triggered on Monday and I decided to close and take profit today (Friday).

Price lingered about 5 pips from my profit target over a two day period, which you can see on the chart above. When price hovered at the same low for two days, I felt that support was forming and closed the trade. This shaved 10% from my intended profit, and as I'm typing this entry, price broke the low and hit my original profit target.

While price lingered near my profit target, I noticed myself checking my trade every couple of hours. This constant checking made me frustrated as my profit target seemed so close, and yet so far. I think this encouraged me to close my trade early and end that negative emotion.

On the chart, you can notice two dojis that formed in the middle of the trade as the price decline slowed. They also spooked me a little. Again, I was asking myself why risk the entire trade just for 5 pips when I've already won 85-90% of my trade?

The discretionary trader inside me thinks that price will continue to fall. A short-term descending triangle was formed, and it looks like the bottom is now being broken.


Monday, September 24, 2012

"Hermes" low volatility daily breakout system

Disclaimer: this system is not intended as financial advice. I'm purely posting this for feedback and discussion. As always, perform your own due diligence before trading.
 
I backtested this system back in August and made a few blog posts about it. I did some further work this week, testing a few more pairs and cleaning up my results.
 
I dub this system "Hermes". It is a low-volatility daily breakout sytem.

SUMMARY

System Type: Breakout
Trade frequency: 8 trades per month
Backtest sample size: 1203 trades
Pairs tested: EURUSD, AUDUSD, USDCAD, USDJPY, EURJPY, EURGBP, USDCHF, GBPUSD
Dates tested: 2001 to mid-2012
Reward-to-risk: 2
Win rate: 40.87%
Profit Factor (approximate after spread): 1.26
Grade: B

Equity Curve from 2001 to mid-2012 – $10,000 initial balance, 1% risk. 2 R:R


Profit factor from pairs tested (after spread):
 
 
SYSTEM DETAILS
 
System Type
 
Breakout
 
System Description
 
Look for a daily range that is half or less than ATR(14). Setup two pending orders in the next day to trade the break of the daily high and low.
 
To trade the break of the high, setup a pending long with entry = yesterday's high + 1 pip. To trade the break of the low, setup a pending short with entry = yesterday's low - 1 pip.
 
Stop loss will be situated at yesterday's low - 1 pip if going long, and ysterday's high + 1 pip if going short.
 
Rationale of System
 
A daily range < 50% of ATR(14) suggests one or more of the following:
 
a) Neutral traders have left the market for the day, standing by to re-enter when a trend (re-)establishes itself
b) The preceeding momentum has stalled, meaning trend-followers are closing their positions and/or the big money are accumulating positions for a trend reversal.
c) Traders in general have left the market, particularly during a holiday period (e.g. XMAS to NYE), but stand ready to flush the market with orders once they return.
 
All three scenarios increase the probability that a day of low volatility will be followed by high volatility, which is where we will make our profit. The daily high and low are good places to place our entries. We use a 1 pip buffer as volatility is currently very low.
 
We trade both the break of yesterday's high and low in the same day. Pending orders should only stand for 24 hours from the start of the new market day. This means that during some days, both our long and short will trigger. The first break may be an unsuccessful fake-out or stop-hunt, but with a 2:1 reward-to-risk, a successful second break will mean that we will still finish in profit.
 
We trade the top 8 liquid pairs. They are:
 
EURUSD
GBPUSD
AUDUSD
USDCAD
USDCHF
USDJPY
EURJPY
EURGBP
 
Indicators Used
 
Average True Range (14) to measure volatility.
 
Entry
 
Break of yesterday's high + 1 pip if long, and break of yesterday's low - 1 pip if short.
 
Stop Loss
 
If long, yesterday's low - 1 pip. If short, yesterday's high + 1 pip.
 
Take Profit
 
2R, where R = |entry point – SL|
 
Example Trade
 
 
Thoughts
 
- Sample size is good, around 1,200, across the top eight liquid pairs from 2001 to mid-2012. The  system seems robust enough.
 
- Some entry signals will occur across multiple pairs on the same day. I'm not sure of the best of trading this. My preference would be to trade no more than 4 signals simultaneously, so with 1% risk per trade, I'm risking 4% on the same day.
 
- During quiet periods and holidays (XMAS to NYE, Easter), you may receive a glut of entry signals as traders leave the market. I took care not to trade on Christmas and New Year's Day themselves, but the days surrounding these holidays will also be quiet and relatively illiquid. My backtest indicate that it's still profitable to trade during these periods, but the glut means your risk exposure may be higher if you trade all of them.
 
- I'd like to test this system on the 4H and weekly charts.

Saturday, September 22, 2012

Entry signals on USDJPY

The USDJPY is flashing two entry signals over the weekend.


Signal #1. Friday's daily range is less than 50% of ATR(14). I'll be placing pending shorts and longs on the break of the high or low on Monday morning. 2:1 R:R.
 
Signal #2. ADX(14) has fallen below 18. The USDJPY has been ranging for some time, but it's not near the recent upper or lower fractals, so it may take a few more days to trigger an entry.
 
But take note of the three candles highlighted in yellow. Their range was less than 50% ATR(14) and would've provided a nice profit at 2:1 R:R. I traded the last highlighted candle and pocketed some profit before the day ended.

Friday, September 21, 2012

A little update

I'm currently doing more backtesting on my daily range < 50% * ATR(14) breakout system. I want to include results for ALL of the top 8 liquid pairs. I only have one pair left to test. I'll hopefully publish my results next week. But so far it's looking very positive.
 
My order on the book Come Into My Trading Room by Dr. Alexander Elder arrived a few days ago. I've read one-third of it so far. A trader should never stop absorbing new information. It's a general trading book with no focus on any particular market, but it provides useful insights on certain indicators that I haven't found anywhere else. I'll post a short review and any notes that I've taken once I'm finished.

Wednesday, September 19, 2012

"Mercury" fractal breakout trading system

Disclaimer: this system is not intended as financial advice. I'm purely posting this for feedback and discussion. As always, perform your own due diligence before trading.
 
I've been sitting on this system for awhile. To be honest, I'm not happy with it. The backtest results are positive, but I'll explain my thoughts towards the end.
 
I'm naming my systems after gods of trade and commerce. I dub this one "Mercury".


SUMMARY

System Type: Breakout
Trade frequency: 3.5 trades per month
Backtest sample size: 492 trades
Pairs tested: EURUSD, AUDUSD, USDCAD, USDJPY, EURJPY, EURGBP, USDCHF, GBPUSD
Dates tested: 2001 to mid-2012
Reward-to-risk: 2.75
Win rate: 32.37%
Profit Factor (after spread): 1.26
Grade: C

Equity Curve from 2001 to mid-2012 – $10,000 initial balance, 1% risk. 2.75 R:R

Profit factor from pairs tested (after spread):


SYSTEM DETAILS
 
 
System Type
 
 
Breakout
 
 
System Description
 
 
Look for the start of a ranging period where ADX(14)(High + Low / 2) is equal or less than 18. When this occurs, apply pending orders at the break of the most recent upper fractal + 5 pips, and lower fractal – 5 pips.
 
 
Stop loss will be situated at 0.75 * ATR(14) pips from the entry price.
 
 
Rationale of System
 
 
A low ADX(14) indicates a ranging period. When ADX(14) < 18, the ranging has become extreme, stops have accumulated outside the range and a breakout is imminent.
 
 
A fractal is most likely to be situated near short-term resistance and support. If a breakout is to occur, the fractal must be broken first. We apply a 5 pip buffer to our entry to increase our odds of entering a genuine breakout.
 
 
We trade the top 8 most liquid pairs only as these tend to provide the most accurate technical signals. They are:

EURUSD
USDJPY
GBPUSD
AUDUSD
USDCAD
USDCHF
EURJPY
EURGBP

Indicators Used

ATR(14) Close for stop loss

ADX(14) High + Low / 2 to filter for ranging conditions

Bill Williams' Fractals indicator

Entry

Break of the most recent upper fractal + 5 pips, or lower fractal – 5 pips

Stop Loss

If long, entry price – 0.75 * ATR(14). If short, entry price + 0.75 * ATR(14)

Take Profit

2.75R, where R = |entry point – SL|
 
Example Trade
 
(from Forex Tester 2)
 
 
Thoughts
 
The system has some weaknesses as it is.
 
#1. Sample size is around 500. I'd prefer it to be closer to 1,000, but the market history only provides 492 trade signals. On the otherhand, it has been tested on eight pairs, with seven out of eight showing positive results, so it seems robust enough.
 
#2. The system has been in drawdown since 2011. I'm really not happy with this, even though the overall equity curve is positive. I'd recommend a position size of 1% or less for this system to reduce the drawdown magnitude.
 
#3. I just get the gut feeling that there's a better entry point than just fractals. When a market's ADX(14) drops below 18, it usually doesn't stay there for long.

Wednesday, September 12, 2012

Fractal backtest COMPLETE

Finally finished my backtest on my fractal breakout system. I decided to only analyse fractal breaks where ADX(14) < 18 on the USDJPY and EURJPY and skip the rest. The USDJPY had a positive expectancy, and EURJPY slightly negative.
 
After deleting duplicated trades from all five pairs tested (EURUSD, USDJPY, AUDUSD, USDCAD, EURJPY), the system has a positive expectancy of 26%. Total sample size is 265 trades. It's low, but I don't have any more low-correlation pairs to test. GBPUSD and USDCHF are highly correlated with EURUSD, NZDAUD with AUDUSD, and GBPJPY and AUDJPY with EURJPY.
 
I thought about testing the more obscure cross pairs like EURCAD, but I don't really want to trade them because of higher spreads and illiquidity.
 
Here is the final equity curve for the system from 2001 to 2011, using 2% risk and 2.67 R:R. All trades are in chronological order. Duplicated trades that occured on the same day between multiple pairs were deleted, with the trade from the most liquid pair kept.


It's not the most sexy equity curve. The system is prone to bouts of drawdown if ranging conditions prevail for too long. The longest losing streak was 14 trades at 2.67 R:R. I'd recommend a risk level of less than 1.5%.

I'll post more details in my next entry. It's past midnight here and I need to sleep.

Monday, September 10, 2012

Latest results on fractal breakout backtest

I just finished the backtest on the USDCAD.
 
This pair would've been horrific if you tried to trade fractal "breakouts" naked. The USDCAD loved to range and retrace, especially after 2006.
 
If you tried to trade fractal breakouts without any filters, expectancy would've been very low or moderately negative as you increased your R:R.
 
I decided to apply an ADX(14) filter to see how it could be used to improve my trades. My original thought was that a higher ADX would improve expectancy since it would indicate a trending market.
 
In fact the opposite occured. Expectancy significantly improved if I traded breakouts when ADX(14) was less than 18. To ensure I wasn't merely curve-fitting, I applied a ADX(14) < 18 filter on the AUDUSD and EURUSD backtest results and found similar improvement.
 
What does this mean? During trending conditions, I suspect that fractals will start appearing at the beginning of a range / consolidation period. So if you try to trade a fractal break when ADX(14) is high, the trend would be fading and you'd lose. This might make a good exit signal in another system. 
 
On the otherhand, when ADX(14) < 18, the market has been strongly ranging for a period of time. Stops would've accumulated outside the range, so a breakout has much more "thrust" when it finally occurs.
 
A 2.67 R:R still provided the best overall ratio, with an expectancy of 39% after spread cost. There were around 190 trades between 2001 and 2011 where ADX(14) < 18. I'm not happy with this sample size and will obviously continue my backtest with more pairs.
 
As of to date, here is my equity curve for this system:


Saturday, September 1, 2012

Skipping trade after a loss - a valid tactic?

My curiosity was piqued during my last entry, so once I woke up this morning, I fired up my backtest results on my daily range < ATR(14) * 0.5 low volatlity breakout system. I decided to see how my results would change if I skipped every trade after a loss.
 
There was little change with overall expectancy or win%. However, the frequency of my trades dimished quite a bit, so this tactic would still be harmful.
 
Some thoughts. My low volatility breakout system isn't very vulnerable to ranging conditions. You're most likely to get an entry signal just after a large movement when the market pauses to breathe. If price starts to range, ATR(14) will adjust and cease to provide entry signals.
 
I think skipping a trade after a loss may be useful if you're using a system that frequently triggers and fails during ranging conditions. Ranging markets can exist for prolonged periods of time, so you may avoid up to 50% of your losses with this "tactic". I'm not sure what other market conditions would suit this.

Update on fractal breakout - skip trade after loss

It's 3am and I need to sleep.
 
I sunk some more time and decided to see what would happen if I skipped the next trade after a loss.
 
Expectancy improved substantially from 9% to 17%. The number of trades dropped from around 310 to 190. which was expected.
 
The equity curve is below, and it looks much more healthy than before:
 

Fractal breakout system on AUDUSD - disappointing results

I spent the last few days backtesting a fractal breakout system on the AUDUSD from 2001 to 2010.
 
Entry = previous fractal + 5 pips
 
SL = 0.5 * ATR(14) 
 
Results were quite disappointing.
 
The system started off well from 2001 to 2004, but then went downhill. This system gets absolutely slaughtered during a ranging market as you will receive many entry signals that quickly reverse. The pic below shows a good example during late 2010.


The ideal R:R was 2.67. The equity curve is provided below:
 
 
So yes, you might make a bit of money with this system. But otherwise it's not an impressive system. And just look at that drawdown towards the end.
 
Now, the reason why I'm posting this system is that I really do feel it has alot of potential. Despite getting slaughtered in ranging conditions, it still made SOME money. Expectancy was around 9%. I need to design a way that will minimise my exposure to ranging markets. I plan to continue tinkering with this system over the next week.

Wednesday, August 29, 2012

Tuesday, August 21, 2012

Going Live

I'm currently opening a new account with Pepperstone. I hope to be trading live again next week with the low volatility breakout system that I described in the last few entries.

My overall aim is to become a mechanical trader by simultaneously trading multiple, low-correlated systems. My vision is :

- a smooth equity curve from using low risk money management (<1% per trade) in combination with multiple systems (the systems in drawdown should be more than compensated by systems in profit at any particular time due to low correlation).

- a rapidly rising equity curve from high frequency of trades (multiple systems will provide many trading opportunities every day. High frequency + the effect of compounding = steep equity curve).