Showing posts with label back test. Show all posts

Saturday, November 17, 2012

Monday breakout backtest is a bust...

I took a break from trading last week and resumed my Monday breakout backtest a few days ago.
 
Results are no longer rosy. I continued my backtest on the AUDUSD from 2004 to 2006, which yielded significant drawdown. I also tested the EURUSD in 2012. With a 2:1 reward:risk ratio and 50% *ATR(14) SL, my profit factor was 0.61. Very poor.
 
Of course, this gives rise to the possibility of a mid-week "Wedneday Reversal" which may be exploitable....

Monday, September 24, 2012

"Hermes" low volatility daily breakout system

Disclaimer: this system is not intended as financial advice. I'm purely posting this for feedback and discussion. As always, perform your own due diligence before trading.
 
I backtested this system back in August and made a few blog posts about it. I did some further work this week, testing a few more pairs and cleaning up my results.
 
I dub this system "Hermes". It is a low-volatility daily breakout sytem.

SUMMARY

System Type: Breakout
Trade frequency: 8 trades per month
Backtest sample size: 1203 trades
Pairs tested: EURUSD, AUDUSD, USDCAD, USDJPY, EURJPY, EURGBP, USDCHF, GBPUSD
Dates tested: 2001 to mid-2012
Reward-to-risk: 2
Win rate: 40.87%
Profit Factor (approximate after spread): 1.26
Grade: B

Equity Curve from 2001 to mid-2012 – $10,000 initial balance, 1% risk. 2 R:R


Profit factor from pairs tested (after spread):
 
 
SYSTEM DETAILS
 
System Type
 
Breakout
 
System Description
 
Look for a daily range that is half or less than ATR(14). Setup two pending orders in the next day to trade the break of the daily high and low.
 
To trade the break of the high, setup a pending long with entry = yesterday's high + 1 pip. To trade the break of the low, setup a pending short with entry = yesterday's low - 1 pip.
 
Stop loss will be situated at yesterday's low - 1 pip if going long, and ysterday's high + 1 pip if going short.
 
Rationale of System
 
A daily range < 50% of ATR(14) suggests one or more of the following:
 
a) Neutral traders have left the market for the day, standing by to re-enter when a trend (re-)establishes itself
b) The preceeding momentum has stalled, meaning trend-followers are closing their positions and/or the big money are accumulating positions for a trend reversal.
c) Traders in general have left the market, particularly during a holiday period (e.g. XMAS to NYE), but stand ready to flush the market with orders once they return.
 
All three scenarios increase the probability that a day of low volatility will be followed by high volatility, which is where we will make our profit. The daily high and low are good places to place our entries. We use a 1 pip buffer as volatility is currently very low.
 
We trade both the break of yesterday's high and low in the same day. Pending orders should only stand for 24 hours from the start of the new market day. This means that during some days, both our long and short will trigger. The first break may be an unsuccessful fake-out or stop-hunt, but with a 2:1 reward-to-risk, a successful second break will mean that we will still finish in profit.
 
We trade the top 8 liquid pairs. They are:
 
EURUSD
GBPUSD
AUDUSD
USDCAD
USDCHF
USDJPY
EURJPY
EURGBP
 
Indicators Used
 
Average True Range (14) to measure volatility.
 
Entry
 
Break of yesterday's high + 1 pip if long, and break of yesterday's low - 1 pip if short.
 
Stop Loss
 
If long, yesterday's low - 1 pip. If short, yesterday's high + 1 pip.
 
Take Profit
 
2R, where R = |entry point – SL|
 
Example Trade
 
 
Thoughts
 
- Sample size is good, around 1,200, across the top eight liquid pairs from 2001 to mid-2012. The  system seems robust enough.
 
- Some entry signals will occur across multiple pairs on the same day. I'm not sure of the best of trading this. My preference would be to trade no more than 4 signals simultaneously, so with 1% risk per trade, I'm risking 4% on the same day.
 
- During quiet periods and holidays (XMAS to NYE, Easter), you may receive a glut of entry signals as traders leave the market. I took care not to trade on Christmas and New Year's Day themselves, but the days surrounding these holidays will also be quiet and relatively illiquid. My backtest indicate that it's still profitable to trade during these periods, but the glut means your risk exposure may be higher if you trade all of them.
 
- I'd like to test this system on the 4H and weekly charts.

Wednesday, September 19, 2012

"Mercury" fractal breakout trading system

Disclaimer: this system is not intended as financial advice. I'm purely posting this for feedback and discussion. As always, perform your own due diligence before trading.
 
I've been sitting on this system for awhile. To be honest, I'm not happy with it. The backtest results are positive, but I'll explain my thoughts towards the end.
 
I'm naming my systems after gods of trade and commerce. I dub this one "Mercury".


SUMMARY

System Type: Breakout
Trade frequency: 3.5 trades per month
Backtest sample size: 492 trades
Pairs tested: EURUSD, AUDUSD, USDCAD, USDJPY, EURJPY, EURGBP, USDCHF, GBPUSD
Dates tested: 2001 to mid-2012
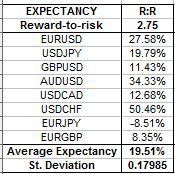
Reward-to-risk: 2.75
Win rate: 32.37%
Profit Factor (after spread): 1.26
Grade: C

Equity Curve from 2001 to mid-2012 – $10,000 initial balance, 1% risk. 2.75 R:R

Profit factor from pairs tested (after spread):


SYSTEM DETAILS
 
 
System Type
 
 
Breakout
 
 
System Description
 
 
Look for the start of a ranging period where ADX(14)(High + Low / 2) is equal or less than 18. When this occurs, apply pending orders at the break of the most recent upper fractal + 5 pips, and lower fractal – 5 pips.
 
 
Stop loss will be situated at 0.75 * ATR(14) pips from the entry price.
 
 
Rationale of System
 
 
A low ADX(14) indicates a ranging period. When ADX(14) < 18, the ranging has become extreme, stops have accumulated outside the range and a breakout is imminent.
 
 
A fractal is most likely to be situated near short-term resistance and support. If a breakout is to occur, the fractal must be broken first. We apply a 5 pip buffer to our entry to increase our odds of entering a genuine breakout.
 
 
We trade the top 8 most liquid pairs only as these tend to provide the most accurate technical signals. They are:

EURUSD
USDJPY
GBPUSD
AUDUSD
USDCAD
USDCHF
EURJPY
EURGBP

Indicators Used

ATR(14) Close for stop loss

ADX(14) High + Low / 2 to filter for ranging conditions

Bill Williams' Fractals indicator

Entry

Break of the most recent upper fractal + 5 pips, or lower fractal – 5 pips

Stop Loss

If long, entry price – 0.75 * ATR(14). If short, entry price + 0.75 * ATR(14)

Take Profit

2.75R, where R = |entry point – SL|
 
Example Trade
 
(from Forex Tester 2)
 
 
Thoughts
 
The system has some weaknesses as it is.
 
#1. Sample size is around 500. I'd prefer it to be closer to 1,000, but the market history only provides 492 trade signals. On the otherhand, it has been tested on eight pairs, with seven out of eight showing positive results, so it seems robust enough.
 
#2. The system has been in drawdown since 2011. I'm really not happy with this, even though the overall equity curve is positive. I'd recommend a position size of 1% or less for this system to reduce the drawdown magnitude.
 
#3. I just get the gut feeling that there's a better entry point than just fractals. When a market's ADX(14) drops below 18, it usually doesn't stay there for long.

Wednesday, September 12, 2012

Fractal backtest COMPLETE

Finally finished my backtest on my fractal breakout system. I decided to only analyse fractal breaks where ADX(14) < 18 on the USDJPY and EURJPY and skip the rest. The USDJPY had a positive expectancy, and EURJPY slightly negative.
 
After deleting duplicated trades from all five pairs tested (EURUSD, USDJPY, AUDUSD, USDCAD, EURJPY), the system has a positive expectancy of 26%. Total sample size is 265 trades. It's low, but I don't have any more low-correlation pairs to test. GBPUSD and USDCHF are highly correlated with EURUSD, NZDAUD with AUDUSD, and GBPJPY and AUDJPY with EURJPY.
 
I thought about testing the more obscure cross pairs like EURCAD, but I don't really want to trade them because of higher spreads and illiquidity.
 
Here is the final equity curve for the system from 2001 to 2011, using 2% risk and 2.67 R:R. All trades are in chronological order. Duplicated trades that occured on the same day between multiple pairs were deleted, with the trade from the most liquid pair kept.


It's not the most sexy equity curve. The system is prone to bouts of drawdown if ranging conditions prevail for too long. The longest losing streak was 14 trades at 2.67 R:R. I'd recommend a risk level of less than 1.5%.

I'll post more details in my next entry. It's past midnight here and I need to sleep.

Monday, September 10, 2012

Latest results on fractal breakout backtest

I just finished the backtest on the USDCAD.
 
This pair would've been horrific if you tried to trade fractal "breakouts" naked. The USDCAD loved to range and retrace, especially after 2006.
 
If you tried to trade fractal breakouts without any filters, expectancy would've been very low or moderately negative as you increased your R:R.
 
I decided to apply an ADX(14) filter to see how it could be used to improve my trades. My original thought was that a higher ADX would improve expectancy since it would indicate a trending market.
 
In fact the opposite occured. Expectancy significantly improved if I traded breakouts when ADX(14) was less than 18. To ensure I wasn't merely curve-fitting, I applied a ADX(14) < 18 filter on the AUDUSD and EURUSD backtest results and found similar improvement.
 
What does this mean? During trending conditions, I suspect that fractals will start appearing at the beginning of a range / consolidation period. So if you try to trade a fractal break when ADX(14) is high, the trend would be fading and you'd lose. This might make a good exit signal in another system. 
 
On the otherhand, when ADX(14) < 18, the market has been strongly ranging for a period of time. Stops would've accumulated outside the range, so a breakout has much more "thrust" when it finally occurs.
 
A 2.67 R:R still provided the best overall ratio, with an expectancy of 39% after spread cost. There were around 190 trades between 2001 and 2011 where ADX(14) < 18. I'm not happy with this sample size and will obviously continue my backtest with more pairs.
 
As of to date, here is my equity curve for this system:


Saturday, September 1, 2012

Update on fractal breakout - skip trade after loss

It's 3am and I need to sleep.
 
I sunk some more time and decided to see what would happen if I skipped the next trade after a loss.
 
Expectancy improved substantially from 9% to 17%. The number of trades dropped from around 310 to 190. which was expected.
 
The equity curve is below, and it looks much more healthy than before:
 

Fractal breakout system on AUDUSD - disappointing results

I spent the last few days backtesting a fractal breakout system on the AUDUSD from 2001 to 2010.
 
Entry = previous fractal + 5 pips
 
SL = 0.5 * ATR(14) 
 
Results were quite disappointing.
 
The system started off well from 2001 to 2004, but then went downhill. This system gets absolutely slaughtered during a ranging market as you will receive many entry signals that quickly reverse. The pic below shows a good example during late 2010.


The ideal R:R was 2.67. The equity curve is provided below:
 
 
So yes, you might make a bit of money with this system. But otherwise it's not an impressive system. And just look at that drawdown towards the end.
 
Now, the reason why I'm posting this system is that I really do feel it has alot of potential. Despite getting slaughtered in ranging conditions, it still made SOME money. Expectancy was around 9%. I need to design a way that will minimise my exposure to ranging markets. I plan to continue tinkering with this system over the next week.

Wednesday, August 15, 2012

50% ATR backtest on AUDUSD

The result of the AUDUSD backtest is pretty bad. With a 2.5 reward-to-risk, expectancy was an unremarkable 1.43%.

However, if we reduce our reward to 1.67R, expectancy climbs to 10.88%. With a 1.67R reward, the expectancy for the USDJPY is 26.68%, and the EURUSD 31.15%.

The equity curves for 1.67R are below:


Sunday, August 12, 2012

50% ATR backtest on USDJPY

I spent most of my Sunday backtesting the USDJPY with the system I described in the previous entry. Gathered around 250 sample trades from 2001 to mid-2012.

An equity curve is presented below, using 2.5 reward-to-risk and 2% risk per trade. This yielded a win% of 37.35% per trade, with an after-spread expectancy of 27.65%.


Wednesday, February 15, 2012

Three black crow backtest continued - USDJPY 2000-2009

I spent the latter half of today backtesting the USDJPY from the years 2000 to 2009, using the same three black crow / three white soldier candle pattern I identified in the previous post.

The results aren't quite so positive. A reward-to-risk ratio of 2 provides a meek positive return on risk, and higher reward-to-risk ratios return negative results. I've provided a comparison between the USDCAD and USDJPY below.


Overall, I would say that this strategy is viable with a reward-to-risk ratio of 2. Because of such a large stop loss, this strategy will require you to keep your trades open for weeks to provide a 2x reward.

Tuesday, February 14, 2012

Three black crows / three white soldiers backtest: USDCAD 2000-2009

I just finished a backtest on the three black crow / three white soldier candle pattern. This candle pattern is quite basic. It consists of three consecutive bearish or bullish candles. Three black crows represent a bearish pattern as seen below, while three white solders are the complete opposite (bullish).


The three candles must be of the same "colour" for it to be considered 3BC or 3WS.

For this backtest, I focused on the USDCAD pair with a 21 EMA to measure the trend. The years 2000 to 2009 were tested, as well as the first half of 2010. I thought about extending the backtest all the way to 2011 but too many orders would've been left open by the end of the backtest.

Stop loss will be located at the start of the first candle, and entry will be triggered at the break of the third candle.

RESULTS

Trading with the trend yielded superior results. In order to prevent cluttering of this post. I'm not going to bother posting the results of trading against the trend.

Final results have been tabulated by year and R:R ratios and are displayed below. 99 trades in favour of the trend were initiated.


Those are nice results. Trading with a reward-to-risk ratio of 6 would have yielded a beautiful average return of 50% on risk. However, that isn't a number that I'm comfortable using. A reward-to-risk ratio of either 2.5 or 3 seems ideal for me.

I'll backtest another currency pair to validate these results.

Monday, February 13, 2012

London Breakout Strategy

I spent yesterday and this morning backtesting variants of the "London Breakout" strategy. I tested the first half of 2010 and the end of 2011 and yielded negative results.

The premise of the strategy is quite simple. You mark the highs and lows of the overnight Asian session, and trade the break of these highs and lows once London opens. The reasoning is that most major market movements will occur during the London session, and the break of the Asian high or low will point the direction of such movements.

So why did my backtest provide poor results? I don't think this is a true "breakout" strategy. It's a given that the Asian high or low will break, even when London decides to horizontally range. I feel that such breaks aren't widely respected by the market, which is what you need to generate momentum behind a breakout.

Rather than solely rely on the break of the Asian range, I may configure my backtest to include candle patterns just prior to the London session e.g. two consecutive bearish candles may signal a bearish breakout on London's open.

Saturday, February 11, 2012

USDJPY inside bar backtest - 2001 to 2008

I just compiled a backtest of inside bars for the USDJPY pair between 2001 and 2008, using a 21 EMA to measure the trend. I'm completely fatigued. This took around eight hours to complete, a great way to spend my Saturday, but I think it's a good indication of my seriousness.

The results of the USDJPY backtest are comparable to the EURUSD, which is excellent, as the USDJPY and EURUSD are one of the least correlated currency pairs. Trading inside bars would be profitable, as seen below.

RESULTS

Trading with the trend
187 trades initiated

Risk:reward ratio = 1:3
Expected return per trade = 19.79%

Risk:reward ratio = 1:2
Expected return per trade = 13.9%

Risk:reward ratio = 1:1
Expected return per trade = 17.65%

Trading against the trend
182 trades initiated

Risk:reward ratio = 1:3
Expected return per trade = 16.48%

Risk:reward ratio = 1:2
Expected return per trade = 13.74%

Risk:reward ratio = 1:1
Expected return per trade = 9.89%

CONCLUSION

It's good to see positive results for a different currency pair. It means that inside bars can be traded beyond the EURUSD. Trading with the trend seems to yield slightly better results, which is expected. Scalping with the trend seems like a safer way of trading with a 1:1 risk:reward ratio.

I'm very pleased. This strategy is looking solid.

Friday, February 10, 2012

10th Feb 2012 - inside bar backtest 2001-2009

I've spent most of this week researching and backtesting. 90% of successful trading is psychological. No matter what strategy you use, if you don't have confidence in your setup, you will fail. The best way of building confidence is to do your own research and backtesting. Manual backtests are very time-intensive but it gives you a better idea of a strategy than automating your backtest.

This week I decided to extend my backtests of inside bars from the start of 2001 to mid-2009. I focused on the EURUSD on the daily timeframe and used a 21 EMA to measure the trend.

RESULTS

Trading with the trend
156 trades initiated

Risk:reward ratio = 1:3
Expected return per trade = 28.21%

Risk:reward ratio = 1:2
Expected return per trade = 23.08%

Risk:reward ratio = 1:1
Expected return per trade = 15.38%

Trading against the trend
130 trades initiated

Risk:reward ratio = 1:3
Expected return per trade = 29.23%

Risk:reward ratio = 1:2
Expected return per trade = 20.00%

Risk:reward ratio = 1:1
Expected return per trade = 3.08%

CONCLUSION

I was quite surprised to see that counter-trend trading is just as profitable as trading with the trend. A 1:2 or 1:3 risk:reward ratio seems ideal, although I am leaning towards 1:2, just to be a little conservative. Higher rewards usually take longer to achieve. The longer you leave your trade open, the more exposed you are to market shocks that invalidate your entry.

Thursday, February 2, 2012

2 February 2012

I attempted to trade a trend-reversing pinbar that appeared on the AUDUSD yesterday but was stopped out. I lost 53 pips from the trade. The AUDUSD is currently trending in an ascending triangle so I'm predicting a bullish breakout in the next few days.

Lesson:
- don't trade into resistance / support zones, especially if they've been well-respected.


Tuesday, January 31, 2012

January 31st Trades + pin bar backtesting

I finished in the green today. This morning I identified a pinbar on the AUDUSD that formed as a rejection of the 8 EMA and trend line. However, a major resistance level existed around 1.0700.

I opened at the start of the new market day. Price movement quickly moved in my favour and I closed my trade about 15 pips short of 1.0700. All up I won around 70 pips.


Pin bar backtests

I conducted more backtesting on pin bars, this time focusing on the AUDUSD and USDJPY pairs. The backtest covered 2008-2010 on the daily timeframe. The criteria is entry upon the breaking of the pin bar candle in the direction of the pin bar's body, with stop loss located at the 50% retracement level of the pin bar.

Trades entered: 65

Risk:reward = 1:4
Win % = 20%
Lose % = 80%
Expected return per trade = 0%

Risk:reward = 1:3
Win % = 25%
Lose % = 75%
Expected return per trade = -1.54%

Risk:reward = 1:2
Win % = 34%
Lose % = 66%
Expected return per trade = 1.54%

Risk:reward = 1:1
Win % = 57%
Lose % = 43%
Expected return per trade = 13.85%

Risk:reward = 1:0.5
Win % = 80%
Lose % = 20%
Expected return per trade = 20%

Conclusion

I didn't find much difference in performance whether the pin bar was traded with or against the trend. However, results suffered badly if the pin bar was traded during a neutral trend. A risk:reward ratio of 1:0.5 is optimal but is vulnerable to large drawdowns if I meet a succession of failed trades. For every failed trade, I must win two just to break even.