Thursday, July 4, 2013

"This is known as the agony" - GBPUSD

I missed out on a 1:5 risk:reward trade on the GBPUSD just now because of an aggressively tight, trailing stop loss.
 
This was the setup I saw last night on the GBPUSD 1H chart. A prominent pinbar formed off a good confluence of technical factors that consisted of:
 
- contact and reaction off the 200 SMA (dark blue solid line)
- a major trend line
- 38.2% - 61.8% Fib retracement level off a major swing high
- prominent pinbar price action signal
 
I used a short limit order at the 50% level of the pinbar, with my profit target just above support at 1.51300. This provided a 1:5 risk:reward ratio. The graphic below shows my setup (you may need to click on it to zoom in, apologies for the tiny detail).


As you can see, price slowly meandered down, until it suddenly crashed as a result of the Bank of England's latest monetary policy decision.
 
I don't like trading news, so just before this moment, I moved my stop loss to breakeven, just in case the news went against me.
 
The news was in my favour (BOE elected to retain loose monetary stance), but the spread just went wild, perhaps over 30 pips, as liquidity evaporated. Most of my trading experience has been on the daily timeframe so far, so I don't see live market reactions to news that often.
 
But that spread was insane, and was enough to hit my stop loss, even though I picked price movement correctly.
 
This bruised my ego since this trade had been working perfectly and I really liked the technical confluence.
 
Lesson: anticipate wide spreads during major news release, and move your stop loss accordingly.

How to triple your upside by halving your risk

Reducing your risk can provide a disproportional benefit to your return through some mathematical wizardry.
 
Suppose, for example, you see the setup below, and you wish to trade the pinbar that has formed at the swing low. The pinbar is about 10 pips in length. Many traders would trade this setup by entering on the break of the pinbar, with a stop loss at the end of the long wick. For this example, suppose we trade this conservatively and aim for a 1:1 reward:risk ratio, so our profit target is 10 pips (the same size as our stop loss).


Suppose we trade this more aggressively, and decide to enter at the 50% level of the pinbar, while keeping our stop loss and profit target at the same locations. The size of our stop loss is now 5 pips, half of the original setup. Our profit target is now 15 pips, instead of 10. Our new reward:risk is now 3:1. Even though we've halved our stop loss, we've tripled the size of our reward.


With a bit of aggression, we've tripled our reward from the same setup.
 
Of course, this doesn't always work. Sometimes price may not retrace 50% at all, and we miss out on a profitable trade. Or price will simply smash its way through our entry and hit our stop loss. However, this shows the benefit of tight stop losses and the disproportionate benefit it provides to R:R ratios. Remember, it's not about how many pips we win or lose, but how big our reward is relative to our losses.

Tuesday, June 25, 2013

Losing trade on the USDJPY

This was a trade I lost not long ago on the USDJPY, using the 5M chart.

I think I forced this trade. The confluence was weak. My candle entry signal occurred just outside the major 38.2% - 61.8% retracement area, and the candle itself wasn't prominent.

However, as you can see on the left side of the chart, there was sharp, convincing downward movement just prior. The upward retracement looked weak and indecisive. Plus, at my point of entry, I was getting a R:R of 3.5:1. I only needed a win-rate of a little less than 33% to breakeven.


Monday, June 24, 2013

Could've traded this better? AUDUSD

This was a trade I performed 15 minutes ago on the AUDUSD 5M chart. I'm still tinkering with confluence trading and recently added pivot points to my tool belt.
 
A chart of my trade is below. We see a prominent pinbar form within the 38.2% - 61.8% retracement area. It's also touching the daily pivot point, and in the direction of the 200 EMA (grey solid line). Confluence is good.
 
I entered short and initially aimed for a 3:1 reward:risk, but took profit quite early when the downward movement stalled for a bit. My final R:R was a little over 2:1. Not bad, but as you can see in the chart below, I could've done ALOT better.


My reason for taking profit early was the higher swing low that had formed previously. Since price was stalling at a good potential bullish trend line, I asked myself why risk 3R just to win an extra 1R? So I closed here. It was a conservative play.

Thursday, June 20, 2013

Fibonacci retracements - another tool in the belt

I've been spending the last week practising Fibonacci retracements. I've ignored Fibonacci levels and Elliot Wave theory, thinking they were too subjective to use, but I've been surprised by how well Fibs are respected when used in conjunction with other technical tools like trend lines, support / resistance and candlestick patterns.
 
This was a trade I did not long ago on the USDCHF 5M chart. I plotted the Fib retracement levels from the most recent major swing low and swing high. From my own observations, you'll very likely see the end of a retracement, and resumption of the trend, within the 61.8% and 31.2% levels.
 
I also saw that a resistance level had previously been formed around 0.92700. The 200EMA showed a bullish bias. The bullish candle that formed after price touched resistance & Fib levels told me that price was ready to move up. This confluence of technical factors indicated a good opportunity to go long.
 
I took profit as price reached the previous swing high and began slowing down. All the while I was trailing my stop loss, moving it to breakeven once price was halfway towards my profit target. This is a type of trade that either succeeds, or you get out quickly at minimal cost. We're not hanging around for a second retracement of a similar magnitude as the first, as this would mean the trend is breaking and our chances of finishing in profit is diminished greatly.
 
Below is a snapshot of my trade. You might have to click on it to zoom in.


Wednesday, June 12, 2013

A very good trade on the CADCHF today...

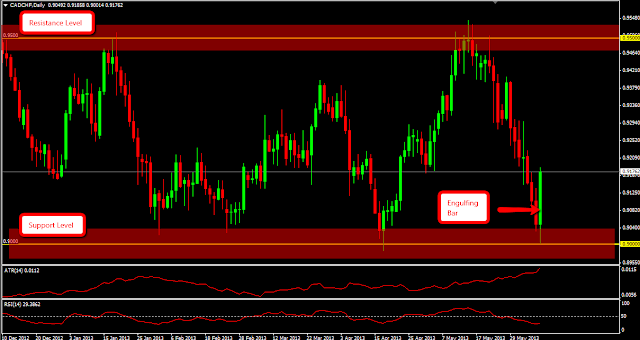
This is the original setup that I posted on Sunday night, with an inclination to go long on the break of the engulfing bar. I predicted continued bullish action from support at 0.9000.


My long was triggered yesterday and price moved in my favour for a bit, until it reversed and closed as a pinbar reversal signal.
 
The "old me" would've kept the order open until my stop loss was hit, just below 0.9000. I then thought about it.
 
The pinbar formed along a trendline, as well within the 38.2-61.8% Fibonacci retracement level. The momentum of the last few weeks was also very bearish. To me, the probability of a successful trade became diminished. If 0.9000 was to be re-tested so soon, then it told me that institutional money was determined to break it.  


Rather than wait for my stop loss to get hit, I saw an opportunity to cut my trade at a very cheap price, which I did. I then decided to trade the reversal.


I felt if institutional money was going to re-test 0.9000, it wasn't going to waste time. Rather than set my stop loss at the top of the pinbar, I moved it a bit lower in order to provide a 2:1 reward-to-risk ratio. I set my profit target a little above 0.9000. The trade closed in profit a short awhile ago so I'm pretty happy about how I traded this.

Sunday, June 9, 2013

Upcoming signal: CADCHF

Only saw one signal over the weekend that I like. The CADCHF has been ranging between 0.9000 and 0.9500 since the start of the year. An engulfing bar has appeared at a solid, well-respected support level of 0.9000. Other CAD pairs show highly-correlated candles.