Disclaimer: this system is not intended as financial advice. I'm purely posting
this for feedback and discussion. As always, perform your own due diligence
before trading.
I backtested this system back in August and made a few blog posts about it. I did some further work this week, testing a few more pairs and cleaning up my results.
I dub this system "Hermes". It is a low-volatility daily breakout sytem.
SUMMARY
System Type: Breakout
Trade frequency: 8 trades per
month
Backtest sample size: 1203 trades
Pairs tested: EURUSD, AUDUSD,
USDCAD, USDJPY, EURJPY, EURGBP, USDCHF, GBPUSD
Dates tested: 2001 to
mid-2012
Reward-to-risk: 2
Win rate: 40.87%
Profit Factor (approximate after spread): 1.26
Grade: B
Equity Curve from 2001 to mid-2012 – $10,000 initial balance, 1%
risk. 2 R:R
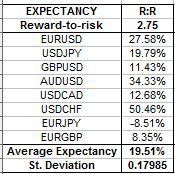
Profit factor from pairs tested (after spread):
SYSTEM DETAILS
System Type
Breakout
System Description
Look for a daily range that is half or less than ATR(14). Setup two pending orders in the next day to trade the break of the daily high and low.
To trade the break of the high, setup a pending long with entry = yesterday's high + 1 pip. To trade the break of the low, setup a pending short with entry = yesterday's low - 1 pip.
Stop loss will be situated at yesterday's low - 1 pip if going long, and ysterday's high + 1 pip if going short.
Rationale of System
A daily range < 50% of ATR(14) suggests one or more of the following:
a) Neutral traders have left the market for the day, standing by to re-enter when a trend (re-)establishes itself
b) The preceeding momentum has stalled, meaning trend-followers are closing their positions and/or the big money are accumulating positions for a trend reversal.
c) Traders in general have left the market, particularly during a holiday period (e.g. XMAS to NYE), but stand ready to flush the market with orders once they return.
All three scenarios increase the probability that a day of low volatility will be followed by high volatility, which is where we will make our profit. The daily high and low are good places to place our entries. We use a 1 pip buffer as volatility is currently very low.
We trade both the break of yesterday's high and low in the same day. Pending orders should only stand for 24 hours from the start of the new market day. This means that during some days, both our long and short will trigger. The first break may be an unsuccessful fake-out or stop-hunt, but with a 2:1 reward-to-risk, a successful second break will mean that we will still finish in profit.
We trade the top 8 liquid pairs. They are:
EURUSD
GBPUSD
AUDUSD
USDCAD
USDCHF
USDJPY
EURJPY
EURGBP
Indicators Used
Average True Range (14) to measure volatility.
Entry
Break of yesterday's high + 1 pip if long, and break of yesterday's low - 1 pip if short.
Stop Loss
If long, yesterday's low - 1 pip. If short, yesterday's high + 1 pip.
Take Profit
2R, where R = |entry point – SL|
Example Trade
Thoughts
- Sample size is good, around 1,200, across the top eight liquid pairs from 2001 to mid-2012. The system seems robust enough.
- Some entry signals will occur across multiple pairs on the same day. I'm not sure of the best of trading this. My preference would be to trade no more than 4 signals simultaneously, so with 1% risk per trade, I'm risking 4% on the same day.
- During quiet periods and holidays (XMAS to NYE, Easter), you may receive a glut of entry signals as traders leave the market. I took care not to trade on Christmas and New Year's Day themselves, but the days surrounding these holidays will also be quiet and relatively illiquid. My backtest indicate that it's still profitable to trade during these periods, but the glut means your risk exposure may be higher if you trade all of them.
- I'd like to test this system on the 4H and weekly charts.


