Tuesday, December 31, 2013

AUDJPY: Progress on shaved candle system

This is a follow-on from this post.

My sample size is now 251. I did some more tinkering and discovered that a time-based filter seemed more useful than a range-based filter. This is the equity curve for all trades taken between 00:00 and 14:00 GMT, which roughly cover the Asian, European and Europe/US overlap sessions. It seems to do poorly during the US session, which shouldn't be too surprising.

Reward-to-risk = 1.75:1. Risking 1% per trade.


Now this is starting to look interesting. Max drawdown is currently 11.9%.

Monday, December 30, 2013

2013 in review...

With 2013 drawing to a close, I think it might be a good time to reflect over the last 12 months...

The Good

+ Officially going pro. My biggest achievement for this year. I finished the Australian financial year in profit (end of June 2013), so I had to register myself as a sole trader to the tax office to declare my winnings, and hire a professional accountant. I have my own Australian business number (ABN) certificate which I proudly hang on my wall. I'm officially in business, although my capital reserves aren't sufficient to live off full time (yet).

+ System development. I developed quite a few mechanical systems over the last year, especially on the weekly charts (Daikoku, Al-Kutbay, Ek-Chuah, Cernesus and Set).

+ Integrating fundamental analysis and discretion. I think this is another major development. My faith in a 'holy grail' or pure mechanical trading has subsided over the last 12 months as I witnessed for myself the pitfalls of mechanical trading. Price moves because of fundamentals (which ultimately determine order flow). Technicals are useful in determining entries and exits. I think combining both is key to becoming a professional trader.

+ Finding my favourite currency pair (the AUDJPY). The AUDJPY is sexy. It's one of the most volatile pairs during Asian trading hours, and it's excellent for carry trades (although it has been eclipsed by the NZDJPY). The spread is also competitive. Living in Australia, I also have a good grasp on the AUD side, and can make fundamental plays more easily than other pairs.

+ Quietly accumulating capital from my day job. I've been dollar-wise and avoided big expenditures, but I've also been penny-foolish (main culprit = energy drinks and food courts). 

The Bad

- My performance has been way below expectations for the past six months, primarily due to me experimenting outside mechanical trading and putting my systems aside. For the last six months, I haven't been using the mechanical systems I've created throughout the year. Between July and December 2013, I've been at breakeven trading discretionary and/or experimenting on the lower timeframes.

- Putting backtesting / system design ahead of actual trading. I think if you spend too much time on backtesting or designing systems, you begin to forget about 'live' trading. I found myself slipping back into rehearsal mode and trading 0.01 microlots, if that makes sense, even though I've designed some trading methods that look profitable and are ready to trade live.

- Realising my data is a bit more dirty than I thought. I mainly use Forex Tester 2 for my backtesting, and discovered that Forexite shaves at least an hour off Friday. This doesn't really matter on the weekly chart but it has made me less confident in mechanical trading (dirty data was one of the pitfalls that I'd observed, and why you shouldn't be completely reliant on mechanical trading).

The Ugly

- The lower timeframes aren't as scary as I thought. Many gurus like to label the lower timeframes as 'noise' but there is still market structure. I haven't found a way to trade the lower timeframes profitably, though. I've also found the return on time very poor. 

- I'm beginning to think that it's going to take alot longer to achieve financial freedom. This means that I have to set my financial goals lower. So instead of fantasising about my own million-dollar penthouse, I'd be happy to buy a decent RV to travel and live in. This has kinda sucked the passion and excitement out of me.


Overall, the last 12 months have been good. Not as great as I envisioned, but I think better than most noobie traders. Here's to 2014. :)

Saturday, December 28, 2013

Little update on AUDJPY 1H shaved candle system

I spent most of today backtesting a new idea on the AUDJPY 1H charts and it seems to show a little promise. 

The sample size is only 100 so it's much too early to give it a green tick. What we're looking for is a 'shaved candle' where the short wick makes up less than 10% of the candle's size. Plus the candle must be at least moderately big. For purposes of the backtest, the candle's range must be over ATR(24). (ATR(24) simply means the average range of the last 24 candles).

Here are a few examples:


For the backtest, I put the entry as the break of the short wick + a 1 pip buffer, and my stop loss as the opposite end of the shaved candle with a 1 pip buffer.

This is the equity curve at 1% risk per trade, with a reward-to-risk of 1.75:1.


It looks okay. But with it being on the 1H chart, the frequency of trading is relatively high. I only backtested two months to get 100 trades, so that's over a trade per day. I'll become more confident once I've compiled 300 samples, which might take 3-4 days. 

Friday, December 20, 2013

Scalping session review: 18th, 19th & 20th December 2013

I'm not sure if my scalping methodology has an edge. I'm using price action, primarily engulfing candles, as entry signals along support and resistance levels. 

18th December 2013

Only took a single trade that day because of work. 

Trade #1

Pips won = 1.1 - 0.5 = 0.6 pips


I went short after seeing a strong bearish engulfing candle. Price fell to only a few pips from my TP but then rebounded upwards. I decided to get out once price neared breakeven and only won 0.6 pips.

19th December 2013

Trade #1

Pips won = 0.6 - 0.5 = 0.1 pips


Looking back, this was a stupid trade. I saw two small bullish candles bounce off 103.900 and decided to go long here. I ignored the strong bearish action that had occurred in the last hour. My main mistake was going long way too early. When you want to trade against the trend, you want to see price move horizontally for awhile first. This means that the trend is dying, and thus increases the probability of success for a counter-trend trade. Fortunately I got out when I saw that price wasn't moving up as quick as I anticipated.

Trade #2

Pips won = 1.2 - 0.5 = 0.7 pips


The entry signal was better this time: a tiny doji at support followed by a bullish engulfing candle. I went long at the close of the engulfing candle, but exited when the next candle closed as a pinbar. The pinbar formed just below 104.000, a round number, so I played it safe and exited. I missed out on the up move that followed. 

Trade #3

Pips lost = -2.8 - 0.5 = -3.3 pips


This trade went wrong. I held on to it longer than I should've. I saw a very strong bullish engulfing candle and went long on the close. I was a little burnt about the fact that I missed the upmove in my previous trade so I resolved myself to hold on to this trade until my hard SL was hit (placed just below the engulfing candle). 

The next candle was a small pinbar. If I was trading with discretion, I would've got out at a minimal loss. The next candle after the pinbar continued to move downwards. At this time I could detect that the pinbar was forming a swing high, and closed my trade when price momentarily moved back up a bit. As you can see, this was a good decision as price would've eventually taken out my stop loss. 

20th December 2013

Trade #1

Pips won = 1.6 - 0.5 = 1.1 pips


I nearly won this trade. Went short after seeing an engulfing candle near resistance, and place my TP at 142.320. Price fell within a pip of my TP before turning upward, at which point I got out. This was the correct move as price eventually broke resistance.  

Thoughts

Intuitively I seem to be practicing  the philosophy that good trades should happen quickly. If price isn't moving in my favour shortly after I open a position, then I get out with a tiny nominal win or loss. I've also noticed that price moved within a pip or two of my TP before reversing, so I might need to tighten up my TP. 

Tuesday, December 17, 2013

Scalping session review: 16th December 2013

I spent over four hours scalping the 5M AUDJPY chart today. A screenshot of of my trades is below. My entries and exits were drawn on the chart by hand, so they're not exact. Click on it to enlarge. :)


Trade #1

Pips won = 3.5 - 0.5 commission = 3 pips

Entry signal = Engulfing candle. Went short shortly after the close of the engulfing candle. There seemed to be quite a bit of space left until 92.000, so I set my TP just above it (around 92.010). Price then stalled around 92.020. At that point, my SL was 10 pips away, so I asked myself why risk 10 pips just to win an extra pip? Price hummed around 92.020 so I manually closed it. Price turned upward shortly after so it was the correct decision.

Trade #2

Pips won = 0.7 - 0.5 commission = 0.2 pips

When I opened my short, price didn't fall as quickly as I liked. When price turned upward, I closed my trade for a very tiny profit. It was a conservative play. Price would've eventually fell and hit my TP.

Trade #3

Pips won = 3.3 - 0.5 commission = 2.8 pips

Saw a pinbar form, followed by a solid, engulfing bearish candle. Went short on the close of the engulfing candle. Took profit just above 92.000. I think this was a good trade.

Trade #4

Pips won = 1.9 - 0.5 commission = 1.4 pips

There was a strong, engulfing bullish candle from 92.000. Went long on the close of the candle. Price then stalled at 92.080 and couldn't break this level for a few candles, so I closed just below here.

Trade #5

Pips won = 0.0 - 0.5 commission = -0.5 pips

This was a breakeven trade, but because of commission, I ended up with a nominal loss. Saw an engulfing bearish candle off resistance. When price refused to fall further after two candles, I decided to close my short for a very tiny loss. It was the correct decision as price eventually broke upwards.

Afterwards, price became choppy so I stayed out and called it a day.

Thoughts

Four hours is a long time to stay focused. The human brain takes alot of energy and I found myself losing focus towards the end. Even as I type, I feel quite sluggish. My eyes feel really dry and tired. 

There wasn't much action during the hours I traded (late Tokyo / early London). The market simply ranged but I think I did okay. 


Saturday, December 7, 2013

Bitcoin investors - lambs to the slaughter

Bitcoin fell 50% in the last few days. Wow!

With no intrinsic value behind Bitcoin, it becomes impossible to agree on a price for Bitcoin, hence the volatility.


Tuesday, December 3, 2013

Win on AUDJPY using 'Ek-Chuah' carry trade system

The AUDJPY closed slightly positive yesterday, so I paper-traded a long using this system that I had created last week. My analysis suggested some bullish strength. Today, I took profit at 0.6R just before the market turned downward.


I've decided to call this system Ek-Chuah after the Mayan god of trade. 

RBA keeps interest on hold

This was today's major news item. No surprises here. The market initially fell in the first five minutes until bargain hunters entered at 93.500.


The market has been ranging since then. The RBA continued to talk down the Aussie dollar, calling it 'uncomfortably high'. In my opinion, talk is always cheap, and present a good opportunity to buy on the dips. The way I see it, if a central bank is talking, then it doesn't want to be doing. The other interesting bit about the RBA's statement is that it is still observing the full effects of two years of rate cutting. This suggests that the RBA is overly cautious about asset bubbles in Australia, a factor which should discourage further interest rate cuts.

Monday, December 2, 2013

AUDJPY Forecast for 2nd December - 6th December 2013

The support level at 92.000 seems to be holding. This level was tested twice last week but managed to hold. 


I haven't opened a new position yet, but if today finishes with a bullish close without touching the 21 EMA, I'd be very interested.

WEEKLY FORECAST FOR 2nd - 6th DECEMBER 2013

News / Fundamentals

AUD

Last week's AUD news releases were mainly favourable. The RBA tried to talk down the Australian dollar, but the effect seem to have been shortlived. Quarter-to-quarter construction beat expectations, expanding at 2.7% versus a predicted 0.6%. Capex also came out above forecast, expanding 3.6% for the quarter as opposed to a predicted -1.1% decline. However, month-to-month private credit only expanded 0.3% versus a predicted 0.4%, but the difference is small. On the sum of this news, it looks like the AUD's fundamentals have strengthened. 

JPY


It's been a relatively quiet week for the JPY, with the news somewhat bearish. Annual household spending and industrial production numbers came out below forecast, and inflation is above expectation. 

EUR

Nothing noteworthy that I can see. 

USD

USD news has been mixed. Tapering speculation continues, which should have a bearish effect on the JPY.

How it all fits together

AUD's fundamentals have strengthened in the face of the RBA talking the Australian dollar down. The RBA is making an interest rate announcement this week. While there is little expectation of a rate decrease, it's likely the RBA will use the opportunity to verbally bash the AUD's value. However, this will most likely be ignored in the face of good numbers, in my opinion. JPY's figures have disappointed the market. Fundamentals suggest bullish movement for the AUDJPY this week. 

News verdict: moderately bullish

Sentiment

According to last week's COT report, JPY shorts have increased to a 12-month high while AUD shorts have remained the same.

JPY


AUD


Sentiment verdict: moderately bullish

Technical Analysis

As illustrated, the AUDJPY seems to have re-bounced off support around 92.000-93.000. The ascending channel is holding. However, it isn't making new highs at the top of the channel.


It's also possible that the AUDJPY is also entering a horizontal range between 92.000 and 94.000. The 21 EMA suggests ranging action. 

Technical verdict: slightly bullish

Upcoming Events

This week should be volatile. The RBA is making an interest rate statement tomorrow (3rd December), plus retail sales, GDP and trade balance figures are coming out in the next few days. Friday is the usual USD Non-farm Payroll release. If the RBA talks the AUD down, I expect buyers to re-enter around 92.500. There are no major JPY news releases this week. 

Overall, fundamentals, technicals and sentiment suggest bullishness for the AUDJPY. I will like to see how today closes before I open a long. 

Thursday, November 28, 2013

AUDJPY: System development on overnight carry

I didn't post my fundamental analysis on the AUDJPY as I've been busy developing and backtesting a new mechanical system. The basic backtest is done. I'm now left with some optimisation, and perhaps exploring variants of this system.

The AUDJPY is traditionally popular for carry trading, due to the interest rate differential between the Reserve Bank of Australia and the Bank of Japan. Basically you borrow JPY at a lower interest rate to buy AUD to lend at a higher interest rate, and since the interest rate on AUD has traditionally been much higher than the JPY, you pocket the interest rate difference. Most currency traders use leverage. Now suppose your leverage is 100x, a 4% interest rate differential with 100x leverage will now provide you with a 400% return on your investment. If the price of the AUD rises against the JPY, you will also profit from capital appreciation. Hence the popularity of the carry trade. 

Interest is typically collected each day at the close of the NY session. This system has you buying the AUDJPY just seconds before the NY close during a bullish trend on the daily chart. Not only will you collect the overnight carry, but bullish momentum should see you profit from a higher AUD in the next day or two.

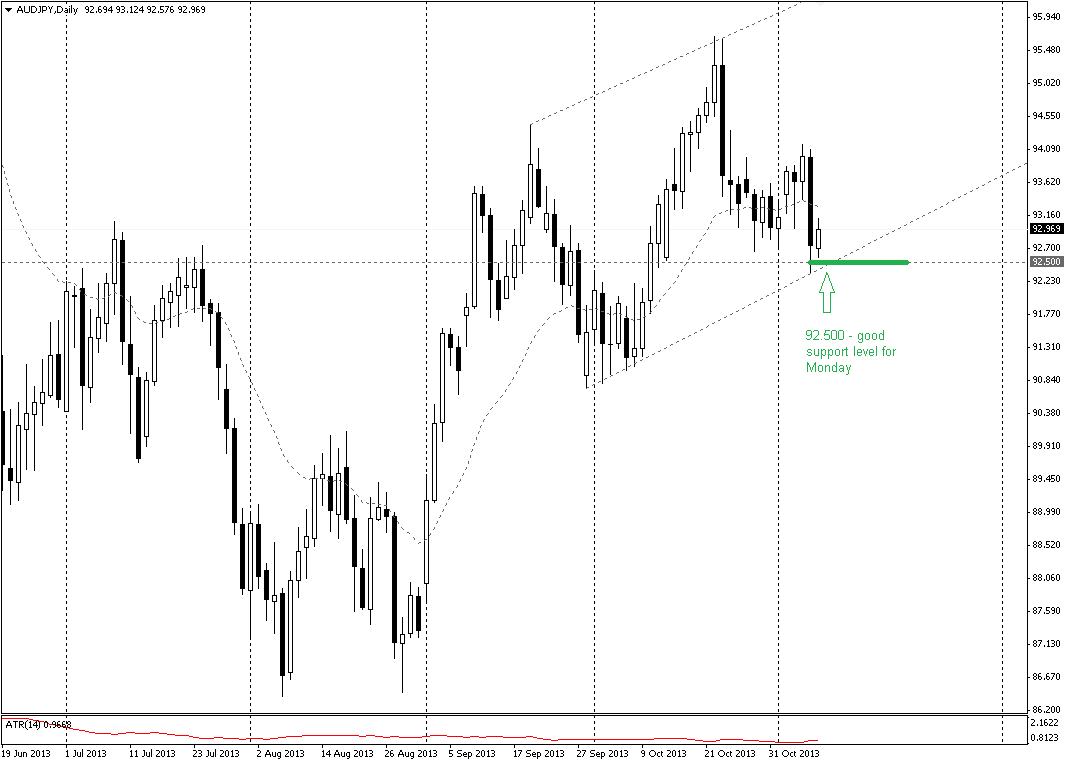
To identify a bullish trend, all I look for is a bullish candle that appears above the 21 EMA without touching it, and the close of the candle must be within the top 50% of the candle. Here are some examples over the last few months (the dotted line is the 21 EMA. Notice no contact between the candles and the 21 EMA. If there is contact, then I assume the market is ranging and you stay out).


For purposes of the backtest, my entry price is the closing price of the candle, since we are entering mere seconds before the NY close. My stop loss is at the bottom of the candle. My sample size was 826 trades, from late 2000 to November 2013. I used the broker Alpari for data, which generally aligns with the New York close.

According to my backtest, a 0.6:1 reward:risk ratio seems best. At 2% risk and a $10,000 starting balance, we get the following equity curve.


We get a very nice R^2.

For robustness sake, this is the equity curve for 0.5:1 reward:risk.


Here is the equity curve for 0.75:1 reward:risk.


So we can see that minor changes to the R:R ratio don't break the system, which is a good indicator of robustness. Also note that these equity curves only graph the profit and loss from the trades themselves. It doesn't include the positive carry that we collect from each trade. If we include the positive carry, our equity curves will look even more healthy, but I haven't figured a way to calculate historical carry rates accurately. Anyway, it looks as if the system itself will generate profit without the need for carry.

Now having said all that, I'm not a big believer in pure mechanical trading anymore. My current philosophy is:

a) generate mechanical systems that can make money if simply traded "as is" 
b) analyse market sentiment and fundamentals
c) if your analysis lines up with the logic of your mechanical system, open a trade

So with this system, I simply wouldn't be opening longs just for the heck of it. If I feel there are good reasons for the AUD to rise, then this mechanical system should give you a good return.

Anyway, this is all preliminary. I would like to do some further optimisation and tinkering on this system so it doesn't have my seal of approval yet. I'm just posting this to hopefully generate some ideas from you guys. :)

Friday, November 22, 2013

AUD: Bulls routed

There's still a few hours left before Friday's close, but it looks like the bulls on the Aussie dollar have routed. A few news release this week looked to have negatively impacted the AUD. This includes RBA Governor Glenn Steven's speech on Thursday, who praised the AUD as a floating currency, but reiterated the RBA's right to intervene (interpreted by the market as bearish). China's flash manufacturing PMI also came out below forecast (50.4 vs 50.9). Anyone trading the AUD as a proxy for China would've been hurt. So overall, this week's fundamentals have hurt the AUD.

Technically, the AUDJPY is back at a support level around 92.500. I think this would make a good place for bulls to buy the AUDJPY at a cheap price (or for bears to position themselves for a breakout on the downside). There's a few more weeks until the RBA's next interest rate decision. However, the ascending channel that I identified earlier is very close to being broken. The high of the channel should also have been touched already (or at least, price should be close to it). Instead we are at the bottom. 


I'll post a more-detailed analysis tomorrow.

Wednesday, November 20, 2013

AUD: RBA Minutes from Nov 5

The AUD rallied yesterday after the release of the RBA's meeting minutes. I don't think the market expected much change from the RBA's statement back in Nov 5. Some relevant highlights:

+ growth of major trading partners remain around long-term average, and expect to pick up slightly in 2014
+ recent Australian growth at below-trend
+ economic headwinds from fall in mining investment, high AUD, weak public demand 
+ housing prices are rising 
+ future business investment predicted due to low level interest rates
+ next year growth expected to be below-trend but will pick up
+ RBA closely monitoring house prices
+ remains concerned about high AUD
+ lower AUD needed for balanced growth
+ no change to interest rates, RBA would like to gauge effects before making any future changes

My summary is that the RBA would like to reduce interest rates further, but is constrained by a potential housing bubble. Seems like the market interpreted this as no immediate threat of a rate cut.   

BoJ will be releasing its monetary policy decision tomorrow. I don't expect any changes. The next RBA announcement is on December 3, a few weeks away. I believe the bulls will have another week to accumulate and drive up the AUD before taking some profit. 

Saturday, November 16, 2013

AUDJPY Forecast for 18th - 22nd November 2013

The AUDJPY seems to be obeying the ascending channel that I drew last week.


I opened a long position at the start of last week at 92.800, with my profit target at 95.400.Unfortunately, I prematurely took profit a few days ago so I'm out of this particular swing trade already. This was purely psychological. When I saw price retreating back to breakeven on Thursday, I decided to close and content myself with a tiny, nominal win. This was my ego sabotaging my trading. I'll continue to "paper trade" this particular price movement since I'm eager to see if I can successfully combine my fundamental and technical analysis.

WEEKLY FORECAST FOR 18th - 22nd November

News / Fundamentals

USD

Last week's major headlines for the USD were bearish, with the US trade gap widening to $41.8b versus a forecast of $38.7b, and unemployment claims jumping to 339k vs forecast of 331k. The US also posted bearish industrial numbers last Thursday and Friday. Future Federal Reserve boss Janet Yellen has also indicated the continuance of QE yesterday. 

These events should contribute to bullish pressure on the AUD, especially the AUDUSD. However, with the price of USD being driven down and Yellen's dovish tone on QE and tapering, the USD retains its attractiveness as an alternative carry trade currency to the JPY. I believe any influence on the AUDJPY will be subdued.

EUR

No major headlines that I can read. 

AUD

News releases on the AUD has been mixed. Consumer sentiment and home loans are up for the month, but business confidence has slid. I don't think these events will have lasting impact come next week.

JPY

Japanese quarter-to-quarter GDP growth came out better than expected, 0.5% versus a forecast of 0.4%. However, last month's current account deficit came in at -0.13T yen vs a forecast of -0.1T yen. Other industrial indicators are also down, so overall the news is mixed. News should provide little bias in either direction next week, in my opinion. The central bank will be releasing a statement on Nov 21, but I doubt that many traders will be sitting out before then - if there are any surprises, I think it'll be further monetary loosening than anticipated. So with regards to the AUDJPY, I think the JPY will provide neutral-to-bullish pressure. 

How this fits together

News verdict: I don't expect last week's events to influence the AUDJPY this upcoming week. Neutral. I expect technicals to play out their course.

Sentiment

OANDA's COT report indicates that shorts on both the AUD and JPY grew last week. JPY shorts are near their highest in the last 12 months, showing extreme bearishness. AUD bearishness is not so strong.

JPY


AUD


Sentiment verdict: moderately bullish

Technical Analysis

As illustrated at the start of this entry, it looks as if the AUDJPY has established an ascending channel after respecting support at 92.500. A pinbar formed off support, lending some technical strength to a bullish outlook. The range of Friday's candle was also large, relative to the five previous candles, suggesting a lack of profit taking from the bulls. All these signs point to the AUDJPY moving up next week.


Two major events are taking place next week: release of the RBA's minutes in its last meeting on Tuesday, and BoJ releasing a monetary policy statement on Thursday. I don't think there will be any surprises, so I think traders will stay in the market before and during these events. The RBA won't be making an interest rate decision until early December so there is at least another week for bulls to drive up the AUDJPY without RBA interference. 

Overall, I expect the AUDJPY to climb, but it will most likely encounter heavy resistance at 95.600 and beyond and turn, should it arrive at these levels next week. It will take some news to push through. 

Tuesday, November 12, 2013

AUD: NAB Business Survey shows mixed signals

The NAB Business Survey came out a few hours ago. The news is mixed. The main change is a fall in business confidence, from 12 in September to 5 in October. This is still a positive number, so businesses are still optimistic, but perhaps the post-election euphoria has died. Business conditions remain mostly unchanged, although still negative. However, all numbers are an improvement / unchanged from August.


Effect on the AUD: given the mixed signals in the survey, I don't expect any major movement on the AUD. The AUDJPY fell 20 pips on the news release, but quickly recovered in less than an hour, suggesting institutional buyers moving in on the dip, a bullish sign.


Monday, November 11, 2013

AUDJPY: 11th November 2013

I lost around 13.5 pips on the AUDJPY today. The market was very choppy. There wasn't much news today, and being a Monday, I expected the market to be a little subdued, but not this much. I won two trades, but lost four. Here's a snapshot of the market I experienced today.


The AUDJPY remained in a 5-15 pip range for most of the Asian and European session. My losses mainly stemmed from trying to trade upside breakouts from this range, especially after some good news on the AUD came out today (new month-to-month home loans increased by 4.4% vs forecast of 3.6%, suggesting increasing confidence among Australian borrowers). 

After four losses, I felt emotionally unbalanced and halted trading. 13 pips isn't alot, but it's the whole concept of being intellectually wrong that tilted me. 

I still think there's good upside potential on the daily chart. Volatility has frozen after a steep fall, and the ascending channel is still in place. It looks as if the 92.000 - 93.000 is behaving as a significant support / resistance level in the last few months.


Two news releases are coming out tomorrow: Japanese M/M Tertiary Industry Activity, and the National Australia Bank's Business Confidence survey. It's the NAB business survey that I'm most interested in. The Reserve Bank has been busy talking the AUD down for the last week. If good news comes out, this should hopefully spur some upside movement and shake out the range over the last two days.  

Sunday, November 10, 2013

AUDJPY Forecast for 11th - 15th November 2013

I discovered a neat COT / sentiment chart at  TimingCharts. If you're looking for free COT / market sentiment information, this is a useful resource.

WEEKLY FORECAST FOR 11th - 15th November

News / Fundamentals

USD

US NFP beat expectations last Friday, so short-term USD momentum should be bullish. This increases the probability of the Fed tapering in the next few months, especially if good news continue. The debt ceiling deadlock between Obama and the Republicans hasn't been resolved though, but I think the market will ignore this until January 2014. 

If tapering is on the cards, what does this mean for the AUDJPY? With USD and EUR interest rates now very low, investors have been using them as alternatives to the JPY for carry trades. Carry traders may start switching their borrowings from the USD to JPY, so this is good news for JPY-paired carry trades. Specifically, this should benefit the AUDJPY and NZDJPY. If the US is improving, this should increase appetite for risk, which is also beneficial for carry trades. 

EUR

The major EUR headline from last week was the ECB's reduction of interest rates to 0.25%. This is on par with the Federal Reserve's range of 0.0 - 0.25%. This should benefit EUR-based carry trades, especially the EURAUD and EURNZD, but harm competing carry pairs like the AUDJPY and NZDJPY.  

However, the stimulus should be beneficial for the world economy and provide a boost for commodity prices, which especially benefits Australia. I think this is how the market saw it last week.

AUD

The RBA chose to maintain its current interest rate at 2.5% last week, although the RBA has indicated its willingness to reduce rates if needed. The next meeting is scheduled on December 3. This means that bulls should have a window for the next few weeks to drive the AUD up without RBA intervention. Bears will be staying out. 

JPY

I haven't observed any important JPY events for the last week.

How this fits together

News verdict: moderately bullish

Sentiment

OANDA's COT report indicate that the large traders are more bearish on the JPY than the AUD. 


Sentiment verdict: moderately bullish

Technical Analysis


Volatility on Friday fell significantly, as we probably saw some short profit-taking before the weekend. This means many of the bears on Thursday are now out.

In light of bullish news and sentiment analysis, we may see an ascending channel forming. If this is the case, I would look for longs on Monday and possibly ride it for the next week or two.  92.500 would make a good support level since it's near Thursday's and Friday's lows and would make the bottom of the ascending channel that I've graphed below. I'd place my SL just below 92.000. TP would be towards the top 25% of the channel. 


Intra-day, I'd be looking for longs on Monday.

That wraps up my plan for next week. I may be completely wrong as this is the first time that I've used all three forms of analysis (fundamental, sentiment and technical).

Friday, November 8, 2013

AUDJPY - 8th November 2013 - Day trade #2

Lost my second trade for today. My forecast isn't playing out so I'm out for the day.


This trade was cheap, with a stop loss of only 2.4 pips. I filled my short at a good price, 92.891. This took place at a good resistance area, where we have confluence with a short-term round number (92.900) and the 50% fib retracement level.


My reward was around 7R, so this was a long-shot trade.

Net pips lost = -2.4 - 0.55 = -2.95 pips

AUDJPY - 8th November 2013 - Day trade #1

This trade failed. Went short at 92.777 but got taken out at 92.825.


I went short when I saw a high-volume, low-volatility candle appaer off 92.800. The AUDJPY generally likes to behave in 10 pip moves, so I thought this was a good area to go short after the bounce from 92.700. 

Net pips lost = -4.8 pips - 0.55 pips commission = -5.35 pips

AUDJPY - 8th November Intra-day Forecast

Bearish. The last swing low on the daily chart got taken out yesterday, and it looks like a lower high fractal is forming today, so I'm looking for shorts.


RBA Statement - November 2013


+ growth with Asian trade partners remain average
+ little change in forecast for next year
+ Australian growth remains slightly below average, but good signs are emerging (rising consumer sentiment & sales)
+ house prices now above 2010 peak, optimism in housing market
+ labour remains soft, unemployment expected to rise next year
+ inflation at or below target
+ expect mining investment to decline

RBA policy:
+ desires lower AUD
+ content with monetary stimulus already in place
+ open to cutting rates if needed while meeting inflation target (current inflation = 2.2%, target range = 2-3%)

My thoughts

Housing bubble is emerging, which the RBA may be wary of pumping further. Mixed signals and rising consumer sentiment suggest no drastic need to cut rates. Inflation is in the lower target range, so the RBA still has some bullets left. RBA will try to talk down the AUD and stir uncertainty regarding interest rate cuts. 

RBA probably won't cut rates until the end of the year, if at all.

Thursday, November 7, 2013

AUDJPY - 7th November 2013 - Day trade #1

I only took one trade today.

I took a look on the daily chart and felt that the AUDJPY would behave bullish for the next week or so, based on technicals.


This meant that I'd be looking for long opportunities today.

Earlier today, weakish Australian unemployment figures came up, with the unemployment rate nudging up 0.1% and 30k full-time jobs lost. While this was bad news, I didn't feel it was that bad, and could be a statistical blip. I felt the plunge had been overplayed, and buyers would be looking to get in at some point, which would be around 93.400. At this point, price had also moved beyond 50% of the daily ATR(14), suggesting there isn't much downside left for the day.


Once the range formed around 93.400, I looked for tell-tale signs of an upturn, mainly high-volume, low-volatility candles. I timed it a little too early, though, as you can see. Price dove a bit before finally breaking out on the upside. I took profit just below 93.500.


Net pips won = 6.1 pips - 0.55 pips = 5.55 pips

I was aiming for 93.600 but when price stalled at 93.500 for a couple of candles, I decided to close here. I got the gut feeling that the market will range for most of today. There isn't any strong reason to rally after the earlier plunge.

I got work so that's all my trading for today.

ADDENDUM

I just took a look at my chart after finishing work and noticed that the AUDJPY shot up and completely recovered from the AUD-related unemployment plunge that took place earlier today.


The rallies were triggered by non-AUDJPY news events. The European Central Bank reduced rates to 0.25%, and US jobless claims for this week came well within expectations. How did these events influence the AUDJPY?

The AUDJPY reacted positively to the EUR interest rate drop. This meant good news for Australia, and bad news for Japan. Why? Some thoughts:

- yield on the EUR fell lower, making the AUD relatively more attractive for yield seekers (the AUD still retains one of the highest interest rates amongst developed countries. With the 2nd most traded currency now near 0 percent, the AUD shines even brighter).
- the Eurozone is a manufacturing zone. Stimulus should help commodity prices, thus help the AUD. In contrast, it doesn't help the JPY, which competes against Europe. 


Now, the AUDJPY's reacton to US jobless claims is quite interesting. US jobless claims came well within expectations (336k vs 335k) so why the highly volatile reaction? I'm quite puzzled. US jobless claims did fall, but as it was within the overall forecast, this should have been priced in already. I guess this was good news, even if expected, and the USD rallied anyway. I'm guessing the AUDJPY moved due to some correlation with the USDJPY, taking out stops on the upside and triggering its own rally.


Chris Lori's AUDJPY course

I just bought Chris Lori's AUDJPY course (found here). The course comes in two components: a DVD set and an online component. The DVD set will take a few weeks to arrive, but I have access to the online material and found it interesting so far. 

This also means that I'm shifting my focus from the EURJPY to the AUDJPY. As an Australian-based trader, I think this will make a better fit than the EURJPY, especially for daytrading where AUD and JPY news releases will occur during the Sydney / Tokyo sessions. Also, living in Australia provides an information advantage on the AUD side. 

Sunday, November 3, 2013

Still plugging away on EURJPY daytrading system

The EURJPY has become my obsession over the last month. My system development has moved lower from the 5M timeframe to the 1M timeframe.

Many people say that the 1M chart is just noise, but it really depends on what you're looking at. If you're trying to trade candlestick patterns like pinbars or dojis, then I'd agree. The candlestick patterns produced are probably meaningless. However, information that is "smoothed" out tend to be more clean, such as moving averages or average true ranges. 

The following is an equity curve of my "range breakout" system on the 1M chart. The thing with the 1M chart is that you can catch some REALLY big breakouts. A 20 pip reward breakout may not seem much, until it's measured against a 2 pip stop loss, which is what you're dealing with on the 1M chart. The equity curve is based on a 4:1 reward:risk ratio and 1% risk per trade. The sample size is only 100. 


These trades took place over six days in April 2011. Achieving a 50% return in such a short span seems a little too 'holy grail'. 

Tuesday, October 29, 2013

Intra-day data solutions

My intra-day system development took a setback due to confusing 5M data. I'm now testing a Tokyo open, range breakout system. The problem is that pinpointing historical opening times can be very confusing due to changes in daylight savings, AND the fact that brokers aren't always clear in how they set their server time.

It took a whole day to find what I think is a solution to this problem. I use Forex Tester 2 to backtest historical data. For actual data to backtest on, I've used a standard subscription with Forex Tester, which gives me 5M data from different brokers like Alpari, FXCM, Forex.com etc. 

The best data for intra-day trading, IMO, is FXCM. Their server time is set to GMT, so there's no confusion over daylight savings (unlike other brokers, which may set their time to local time or the NY close). This allows you to accurately pinpoint the start and end of various market sessions. Plus their data is 5-decimal digits (or 3-decimal digits for JPY pairs).

As for finding actual market session times, there are threads by Clint on Babypips that contain this information. e.g. Forex Trading Sessions --- September 2012 - April 2013. You can use the search function on the forum to find times for other months. This saved me alot of headache!

Saturday, October 26, 2013

Week in Review: 21st October 27th October 2013

Last week, I saw three signals that I liked - USDCAD and NZDJPY on the daily chart, and gold (XAUUSD) on the weekly chart. Just before Monday opened, I realised that all three pairs were commodities (CAD, NZD and gold) and felt uneasy opening all three trades. I decided to trade the USDCAD on Monday and stay out of NZDJPY and gold. 

By Monday's close, the USDCAD triggered my long, but barely moved up. In fact, volatility on Monday fell further. On Tuesday, the NFP for September came out and reversed the USDCAD. 


Just before the NFP came out on Tuesday, I examined the situation and felt uneasy keeping my trade open. NFP is one of the most volatile news releases in forex, and I questioned whether it was wise to risk 1R for a 0.5R reward as my system dictated. Additionally, a profit target of 0.5R usually gets hit on the day my order is triggered, which didn't happen here.

Risking 1R for 0.5R was a stupid logic to use prior to a news release and since I didn't have a system to trade news releases, I decided to close and take profit, albeit a small profit. But it was a good decision since the NFP came out below expectations and would've taken out my stop loss. I think this was good trader thinking. 

System Development

I'm still backtesting data on the EURJPY 5M chart with different filters and exits etc. I'm trying to generate more entries. ATM it remain very positive, but I want to be sure of my results before I post anything. This may take awhile. 

Monday, October 21, 2013

Interesting development on my EURJPY 5M system

I just finished backtesting all EURJPY 5M data that I have for 2013 and found some good results. 

The logic of this system is similar to what I use with my daily Hermes and weekly Daikoku low volatility breakout systems, in that we lookout for a period of low volatility and trade the breakout.

The following diagram is the sort of price movement that we'd expect in a ranging market. Of particular importance is the fact that the short-term moving average will usually hover in the middle of this range. 


The big money is responsible for price movement. When a market is ranging, the big money is accumulating positions, but we usually don't know in which direction until it's too late, after the range is already broken. Also, we can't simply place pending orders outside of the range and trade every apparent breakout as many will be fake or simply a bit of noise. So we need to look for something that's more 'pre-emptive'. I thought volume analysis would help, but so far haven't found anything I could really use.

So how do we pre-emptively detect the break of a range? Remember that the market is an auction market, with buyers and sellers bidding their wares. Once price approaches a level they like, buyers enter the market and bid against each other for supply, driving price up (vice versa for sellers).


A ranging market ends when buyers run out of supply to buy, resulting in a bullish breakout. How do we detect this? Just prior to the bullish breakout, we can observe the final exhaustion of supply on our chart, as shown below:


Note where the point of exhaustion is relative to the moving average. We have a good probability that sellers are exhausted if the market turns upwards ABOVE the moving average. If the market had turned upward below the moving average, then it's more likely that we are still in a ranging market. 

So how do we turn this into a rule-based system? These are the MT4 indicators I used for my backtest:

- 35 EMA
- 14 ADX
- Fractals (under Bill Williams)

The 35 EMA is what we use for our moving average. We use 14 ADX to determine whether the market is ranging or trending. When ADX is less than 20, the market is ranging. 

We look for a setup as follows, where a retracement occurs within a range without touching the 35 EMA (this shows that buyers have bid the price up and sellers are running out of supply). The retracement must have an ADX of less than 20, otherwise we've missed the move.


That's about as much detail as I'd like to get into. These setups don't occur that frequently, perhaps once a day on the 5M chart. These setups seem to work best during the Tokyo and London sessions, unsurprisingly. It fails during NY. 

A reward:risk ratio of 0.75:1 seems to work best. Based on a sample size of 144 trades, my profit factor was 1.55. For a 5M system, I think this is remarkably good, considering just how much transaction costs eat up your profit. 

This is the equity curve I ended up with, using 2% risk per trade.


It's not  the smoothest equity curve, but for something on the 5M chart, I'm surprised I finally found something that might work. The next step would be testing this logic on other pairs. 

Sunday, October 20, 2013

Week in Review: 14th October to 20th October 2013

I only opened one trade this week. Bagged a win on the NZDUSD using my Cersenus system.


System Development

I didn't have much luck on my weekly two-bar engulfing backtest. It provided profitable results (profit factor approximated 1.2), but it was too low for what I desired from a weekly timeframe system. 

I've spent the last few days working on a 5M EURJPY trading system. Will post any interesting results.

Upcoming Signals

Traders should be aware of the low volatility last Friday. I see two signals that I like, using my Hermes system: the USDCAD and NZDJPY.


Gold and silver are also signalling a reversal on the weekly chart. My preference would be to long gold, using my Set system.