Showing posts with label fractals. Show all posts

Saturday, September 22, 2012

Entry signals on USDJPY

The USDJPY is flashing two entry signals over the weekend.


Signal #1. Friday's daily range is less than 50% of ATR(14). I'll be placing pending shorts and longs on the break of the high or low on Monday morning. 2:1 R:R.
 
Signal #2. ADX(14) has fallen below 18. The USDJPY has been ranging for some time, but it's not near the recent upper or lower fractals, so it may take a few more days to trigger an entry.
 
But take note of the three candles highlighted in yellow. Their range was less than 50% ATR(14) and would've provided a nice profit at 2:1 R:R. I traded the last highlighted candle and pocketed some profit before the day ended.

Wednesday, September 19, 2012

"Mercury" fractal breakout trading system

Disclaimer: this system is not intended as financial advice. I'm purely posting this for feedback and discussion. As always, perform your own due diligence before trading.
 
I've been sitting on this system for awhile. To be honest, I'm not happy with it. The backtest results are positive, but I'll explain my thoughts towards the end.
 
I'm naming my systems after gods of trade and commerce. I dub this one "Mercury".


SUMMARY

System Type: Breakout
Trade frequency: 3.5 trades per month
Backtest sample size: 492 trades
Pairs tested: EURUSD, AUDUSD, USDCAD, USDJPY, EURJPY, EURGBP, USDCHF, GBPUSD
Dates tested: 2001 to mid-2012
Reward-to-risk: 2.75
Win rate: 32.37%
Profit Factor (after spread): 1.26
Grade: C

Equity Curve from 2001 to mid-2012 – $10,000 initial balance, 1% risk. 2.75 R:R

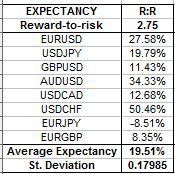
Profit factor from pairs tested (after spread):


SYSTEM DETAILS
 
 
System Type
 
 
Breakout
 
 
System Description
 
 
Look for the start of a ranging period where ADX(14)(High + Low / 2) is equal or less than 18. When this occurs, apply pending orders at the break of the most recent upper fractal + 5 pips, and lower fractal – 5 pips.
 
 
Stop loss will be situated at 0.75 * ATR(14) pips from the entry price.
 
 
Rationale of System
 
 
A low ADX(14) indicates a ranging period. When ADX(14) < 18, the ranging has become extreme, stops have accumulated outside the range and a breakout is imminent.
 
 
A fractal is most likely to be situated near short-term resistance and support. If a breakout is to occur, the fractal must be broken first. We apply a 5 pip buffer to our entry to increase our odds of entering a genuine breakout.
 
 
We trade the top 8 most liquid pairs only as these tend to provide the most accurate technical signals. They are:

EURUSD
USDJPY
GBPUSD
AUDUSD
USDCAD
USDCHF
EURJPY
EURGBP

Indicators Used

ATR(14) Close for stop loss

ADX(14) High + Low / 2 to filter for ranging conditions

Bill Williams' Fractals indicator

Entry

Break of the most recent upper fractal + 5 pips, or lower fractal – 5 pips

Stop Loss

If long, entry price – 0.75 * ATR(14). If short, entry price + 0.75 * ATR(14)

Take Profit

2.75R, where R = |entry point – SL|
 
Example Trade
 
(from Forex Tester 2)
 
 
Thoughts
 
The system has some weaknesses as it is.
 
#1. Sample size is around 500. I'd prefer it to be closer to 1,000, but the market history only provides 492 trade signals. On the otherhand, it has been tested on eight pairs, with seven out of eight showing positive results, so it seems robust enough.
 
#2. The system has been in drawdown since 2011. I'm really not happy with this, even though the overall equity curve is positive. I'd recommend a position size of 1% or less for this system to reduce the drawdown magnitude.
 
#3. I just get the gut feeling that there's a better entry point than just fractals. When a market's ADX(14) drops below 18, it usually doesn't stay there for long.

Wednesday, September 12, 2012

Fractal backtest COMPLETE

Finally finished my backtest on my fractal breakout system. I decided to only analyse fractal breaks where ADX(14) < 18 on the USDJPY and EURJPY and skip the rest. The USDJPY had a positive expectancy, and EURJPY slightly negative.
 
After deleting duplicated trades from all five pairs tested (EURUSD, USDJPY, AUDUSD, USDCAD, EURJPY), the system has a positive expectancy of 26%. Total sample size is 265 trades. It's low, but I don't have any more low-correlation pairs to test. GBPUSD and USDCHF are highly correlated with EURUSD, NZDAUD with AUDUSD, and GBPJPY and AUDJPY with EURJPY.
 
I thought about testing the more obscure cross pairs like EURCAD, but I don't really want to trade them because of higher spreads and illiquidity.
 
Here is the final equity curve for the system from 2001 to 2011, using 2% risk and 2.67 R:R. All trades are in chronological order. Duplicated trades that occured on the same day between multiple pairs were deleted, with the trade from the most liquid pair kept.


It's not the most sexy equity curve. The system is prone to bouts of drawdown if ranging conditions prevail for too long. The longest losing streak was 14 trades at 2.67 R:R. I'd recommend a risk level of less than 1.5%.

I'll post more details in my next entry. It's past midnight here and I need to sleep.

Monday, September 10, 2012

Latest results on fractal breakout backtest

I just finished the backtest on the USDCAD.
 
This pair would've been horrific if you tried to trade fractal "breakouts" naked. The USDCAD loved to range and retrace, especially after 2006.
 
If you tried to trade fractal breakouts without any filters, expectancy would've been very low or moderately negative as you increased your R:R.
 
I decided to apply an ADX(14) filter to see how it could be used to improve my trades. My original thought was that a higher ADX would improve expectancy since it would indicate a trending market.
 
In fact the opposite occured. Expectancy significantly improved if I traded breakouts when ADX(14) was less than 18. To ensure I wasn't merely curve-fitting, I applied a ADX(14) < 18 filter on the AUDUSD and EURUSD backtest results and found similar improvement.
 
What does this mean? During trending conditions, I suspect that fractals will start appearing at the beginning of a range / consolidation period. So if you try to trade a fractal break when ADX(14) is high, the trend would be fading and you'd lose. This might make a good exit signal in another system. 
 
On the otherhand, when ADX(14) < 18, the market has been strongly ranging for a period of time. Stops would've accumulated outside the range, so a breakout has much more "thrust" when it finally occurs.
 
A 2.67 R:R still provided the best overall ratio, with an expectancy of 39% after spread cost. There were around 190 trades between 2001 and 2011 where ADX(14) < 18. I'm not happy with this sample size and will obviously continue my backtest with more pairs.
 
As of to date, here is my equity curve for this system:


Saturday, September 1, 2012

Update on fractal breakout - skip trade after loss

It's 3am and I need to sleep.
 
I sunk some more time and decided to see what would happen if I skipped the next trade after a loss.
 
Expectancy improved substantially from 9% to 17%. The number of trades dropped from around 310 to 190. which was expected.
 
The equity curve is below, and it looks much more healthy than before:
 

Fractal breakout system on AUDUSD - disappointing results

I spent the last few days backtesting a fractal breakout system on the AUDUSD from 2001 to 2010.
 
Entry = previous fractal + 5 pips
 
SL = 0.5 * ATR(14) 
 
Results were quite disappointing.
 
The system started off well from 2001 to 2004, but then went downhill. This system gets absolutely slaughtered during a ranging market as you will receive many entry signals that quickly reverse. The pic below shows a good example during late 2010.


The ideal R:R was 2.67. The equity curve is provided below:
 
 
So yes, you might make a bit of money with this system. But otherwise it's not an impressive system. And just look at that drawdown towards the end.
 
Now, the reason why I'm posting this system is that I really do feel it has alot of potential. Despite getting slaughtered in ranging conditions, it still made SOME money. Expectancy was around 9%. I need to design a way that will minimise my exposure to ranging markets. I plan to continue tinkering with this system over the next week.