Monday, December 29, 2014

29 Dec 2014: Daytrade #2

I tried to trade this M5 range on the EURJPY. The salmon-coloured zones represent support / resistance zones. 

I saw that a range was forming, and went long after I saw price bounce off support. 

Price didn't move up as strong as I expected. When price reached halfway through the range, I moved my stop loss to breakeven. I expected price to go up or I was out. I was stopped out at breakeven.

After awhile, the bears gave up and price resumed moving upwards again. 

I thought this trade was okay. If price was having difficulty ping-ponging in a range, it's a sign that bears (or bulls) are gaining the upper-hand. 

(click to enlarge)


29 Dec 2014: Daytrade #1

Didn't do much trading during the Xmas break. I had alot of hours at work, and needed the rest of my time to Xmas shop or relax.

I only had time for one trade during my lunch break today. I saw this setup form on the AUDUSD. M5 and H1 charts showed bullish strength, and I felt this newly-established resistance level would break, especially after I saw the short retracement to yesterday's high. 

I got out at 1.25R. I wanted to get out just before the major swing high, which I've marked on the H1 chart. I'm not sure if this was the right decision. It was a conservative play. 

As price rose to the resistance level, I moved my stop loss to breakeven, so I at least did this part right. The level was going to break, or I was going to get out quickly. 

(click to enlarge)


Wednesday, December 24, 2014

How to trade a range breakout

How should we trade the breakout of a range? These are some possibilities that I've thought of.

All the following strategies assume that we expect a breakout on the upside, and therefore want to go long.

Strategy 1 - Buy at Resistance

We buy at the range's resistance. At resistance, I believe that the 'big money' may exploit the liquidity offered by sellers, and take the opposite side to fill their buy orders. It seems counter-intuitive, but if buyers aren't able to fill enough of their orders along the range's support level, their only alternative is to buy at resistance.

If price moves to resistance and doesn't move down, and we see alot of tick activity within a narrow candle, that's usually a sign of 'big money' buyers buying from sellers. Once there are no more sellers left, we have a breakout.

To trade this strategy, we may buy at resistance, with a tight stop loss along the middle of the range. We expect resistance to break quickly, or we are out at the first sign of failure.


Pros:

- Little trade management or decision making required. The trade either moves in our favour quickly, or we are out.
- Tight stop loss can give us a good reward:risk ratio.
- Can move stop loss to breakeven if there's a fakeout.
- Stop loss is not at an obvious place (in the middle of the range. Most stop losses will be located outside the range)
- We are trading with near-term momentum. 

Cons:

- Can get chopped out if the battle between bulls and bears becomes volatile.
- Requires careful timing and observation.
- A long-lasting range can mean many losses.


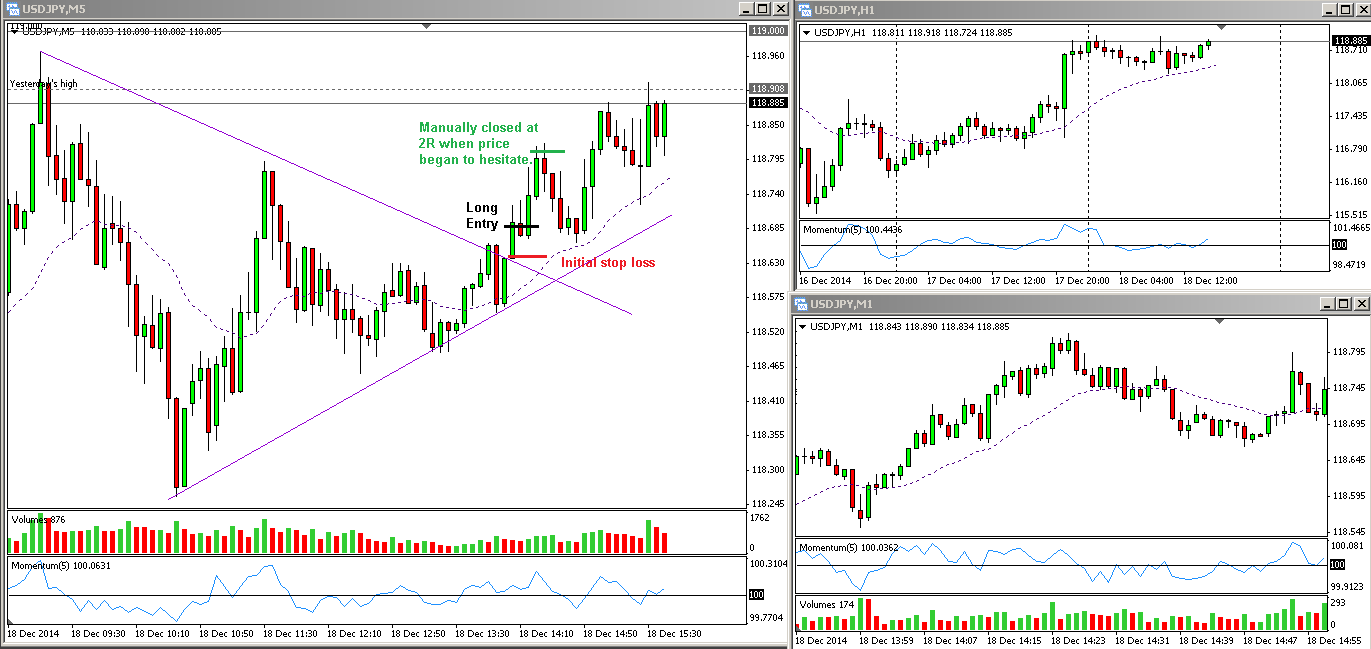
Strategy 2 - Buy at Support

We buy at the range's support. We know there will be a glut of buy limit orders from the 'big money' at support, causing price to return back into the range. Buying here puts us in sync with the majority of buyers. 

We can spot a possible entry signal by zooming into a lower time frame and looking for a change in momentum.

To trade this strategy, we buy at support, with our stop loss below the support level. As price bounces off support and into the range's resistance level, we have some options:

a) Move our stop loss to breakeven and hope that resistance will break.
b) Take profit if there's no breakout and price is staying within the range.
c) Take profit if there's a fakeout and price has returned back into the range.
d) Trade the breakout if it's successful.


Pros:

- We have some flexibility. We can move our stop loss to breakeven as we watch how price reacts to the range's resistance level. If we don't like the reaction, we can close our trade for a small profit. 
- If resistance breaks but we experience a fakeout, we can still close the trade for a small profit. 
- Since we bought at support, a large portion of the range gets added to our reward. This provides a better reward:risk ratio than all other strategies here.
- A long-lasting range may result in many breakeven or slightly-profitable trades, unlike strategy 1. 
- A buy limit entry can result in positive slippage (bigger reward, better reward:risk ratio).

Cons: 

- Stop loss is at an obvious place (below support), so you may fall victim to stop hunts.
- Near-term momentum is against us.


Strategy 3 - Buy at Breakout

We place a buy stop just above resistance. If the range's resistance level breaks, we buy at the first opportunity and hope to catch the ride upwards.

Buy stops from breakout traders, and stop losses from range traders will accumulate beyond the resistance level. Once resistance breaks, these stops will be triggered, usually resulting in a large and quick surge upwards. We want to be in when this occurs as breakouts can be very large and lucrative.

To trade this scenario, we place a buy stop above resistance, with our stop loss below resistance. We simply wait for resistance to break and trigger our order. 


Pros:

- The simplest strategy of all. We buy as price rockets upwards.
- We can trade all breakouts, even those that do not retrace (refer to strategy 4).
- We aren't harmed by long-lasting ranges. 

Cons:

- Slippage can be significant, especially during the breakout. Our reward:risk ratio can be harmed.
- We miss out on the reward from entering the bottom of the range (strategy 2)
- We will most likely lose from fakeouts (during a fakeout, price won't rise sufficiently to allow us to move our stop loss to breakeven).


Strategy 4 - Buy at Retracement of Breakout

We wait for the breakout to occur, and then buy during a retracement back to the range's resistance level (which is now turned into support). 

Breakout traders whose orders went unfilled may wait for price to fall back to the range's resistance level, and then buy again. Short-sellers who sold at resistance may also exit here at breakeven. Both groups of traders will create bullish pressure, resulting in the end of the retracement, and the resumption of the breakout. 

We can spot a possible entry signal by zooming into a lower time frame and looking for a change in momentum as price approaches the range's resistance.

To trade this strategy, we buy above resistance after the breakout has occurred, and begun retracing. Our stop loss should be below resistance. 


Pros:

- Low slippage (or positive slippage if using a buy limit order).
- The retracement will tend to be more calm than the breakout, giving us more time to assess price action. 
- We will have the opportunity to detect fakeouts and avoid entering.
- We aren't harmed by long-lasting ranges. 

Cons:

- We miss out on breakouts that don't retrace (these are the most lucrative).
- It can be difficult to detect the difference between a retracement and a fakeout.
- We miss out on the reward from entering the bottom of the range (refer to strategy 2)
- Near-term momentum is against us.
- If we do enter during a fakeout, we will most certainly lose (no chance to move stop loss to breakeven). 


Which strategy is best?

I examined each strategy based on the following: Reward Size, Win Probability, Simplicity and Flexibility. I mainly used my gut-feel, although some answers should be obvious. 

Reward Size
1. Buy at Support (we catch the breakout + most of the range as well. We can also profit from failed breakouts and range-bound trades)
2. Buy at Resistance
3. Buy at Retracement of Breakout
4. Buy at Breakout (worst reward size due to slippage)

Win Probability
1. Buy at Support (assuming support holds when we enter, most trades should be at least breakeven)
2. Buy at Retracement of Breakout (can avoid some fakeouts)
3. Buy at Breakout (can't avoid fakeouts)
4. Buy at Resistance (will lose to range-bound trades and any fakeouts where SL hasn't been moved to breakeven)

Simplicity
1. Buy at Breakout (set order and forget)
2. Buy at Support (need to ID entry signal)
3. Buy at Resistance (need to ID entry signal)
4. Buy at Retracement of Breakout (need to differentiate between a retracement and fakeout - can be difficult)

Flexibility
1. Buy at Support (we can move stop loss to breakeven, exit all range-bound trades or fakeouts at a small profit, and trade a successful breakout)
2. Buy at Resistance (can still move stop loss to breakeven during some fakeouts)
3. Buy at Retracement of Breakout (we have the chance to identify a fakeout and stay out)
4. Buy at Breakout (no choice at all)


Conclusion

It seems to me that buying at the range's support level is the best move. We increase our reward substantially, we are buying where the 'big money' is most likely buying, we can watch how price reacts at the range's resistance level, and we can profit from range-bound trades, fakeouts and breakouts. 

Friday, December 19, 2014

19 Dec 2014: Daytrade #1

Not the best trade in the world. I tried to go short on the break of support but was quickly stopped out within a minute. Slippage was pretty bad, and I got out 1 pip above my original stop loss.

My rationale for this trade was that the retracement from the previous touch of support was pretty low (refer to M1 chart). It suggested that momentum was turning bearish if bulls were unable to push the retracement up to the 50% level.

My reward was 2R so this was a trade that simply didn't work out.

(click to enlarge)


Thursday, December 18, 2014

18 Dec 2014: Daytrade #2

I learnt my lesson from my previous trade i.e. moving my entry beyond S/R when trading breakouts. 

In this trade, I spotted a pennant forming on the USDJPY (purple lines = pennant formation). A pennant indicates falling volatility as price converges. However, price can't converge forever. At some point, price must make a decision on where it wants to go next. The break of the pennant usually indicates where price will go.

I went long on the break of the pennant's top side, but placed my entry a good distance away from the pennant itself. My stop loss was relatively tight since this was a breakout trade. I want price to decisively break upwards, or I'm out. 

The breakout from the pennant itself was moderate. When price retraced a bit in the second candle, I moved my stop loss up to -0.5R. I'd set a profit target of 3R, but noticed that momentum was slowing down around 2R. I was trailing my stop loss, but decided to pocket 2R profit. If I had kept my trade open, my trailed stop loss would've been hit for 1.5R reward, so it was a good decision to get out. 

(click to enlarge)


18 Dec 2014: Daytrade #1

This trade was a loss. The USDJPY had been slowly drifting downwards, when I noticed a shift in momentum. 

The USDJPY broke down lower, but the move was actually quite shallow. When price retraced and broke the last swing high, I felt that the trend might be turning, and entered long. Price wavered after my entry, and created a range on the M1 chart. I moved my stop loss to just below the range, although this should've been a warning sign to get out.

The range on the M1 chart broke downwards, hitting my stop loss. I got out at -0.5R. Moving my stop loss to below the range was a good move. However, the market's indecision after 2 candles (or 10 minutes) on the M5 chart should've told me that bulls were having great difficulty breaking upwards. I really should've got out at the close of the second candle. 

My entry could've been placed higher above the swing high. As it was, I was buying right on the resistance level. A few pips higher would've been good. It wouldn't protect me from a fakeout, but it would've protected me from a 100% retracement. 

(click to enlarge)


Tuesday, December 16, 2014

16 Dec 2014: daytrade #14

Today's actually been pretty busy on the USDJPY. I took around 14 trades and made a small profit. My broker will be happy. A few of those losses stemmed from ultra-tight entries and stop losses. 

This was a notable trade I took recently, an hour before New York opens. Bears have been in total control throughout the day, and I was looking for shorting opportunities. Price had stopped moving after the break of 116.000 and I wondered what would happen next.

I theorised that price would retrace back from 115.560 to 116.000, which was also the 50% retracement level of the most recent downswing. Then I thought, if I believed price was going to retrace back up to 116.000, why not go long until then?

I went long at 115.688 and exited at 115.834 when I was that price was struggling to make a new high on the M1 chart. My profit was a little over 1R. 

Trading counter-trend is always dangerous, but if you have a price forecast, it's your job as a trader to trade it. 

(click to enlarge)


16 Dec 2014: Daytrade #1

I'm about to duck out to finish my Christmas shopping. This was a trade I took in the middle of the Asian session. The H1 and M5 USDJPY charts were trending down, so I was looking for shorting opportunities.

Price retraced to the 50% level of the last down swing. I used the M1 chart to time my entry. I utilised the Momentum indicator as confirmation of my entry. When I saw that price was struggling to move higher, with the Momentum indicator showing bearish momentum strengthening, I saw this as a good entry point and went short. 

I took profit at 2.5R when price reached yesterday's low (a support level) and began to waver. Price broke down in the next candle and fell 20 pips. I missed out on this move. Oh well.


Monday, December 15, 2014

15 Dec 2014: Daytrade example

I took nine trades today, which is alot. Sadly, I finished slightly below breakeven (transaction costs consumed the nominal profit I made today).

I added the M1 chart and the Momentum(5) indicator to help manage my trades. I'm still using the M5 chart to measure the trend and identify key price levels. 

I'm also experimenting with daily pivot points. I'm not a big believer in pivot points, but I know that professional traders do use them. 

Below is a snapshot of the 8th trade I took. This was on the USDJPY and the M5 chart showed an uptrend (however, the H1 chart was much more neutral). 

The move up had slowed down for awhile, and I saw a pinbar form at a half-decent location (it formed at the 50% retracement level of the most recent upswing). When I saw that price was having great difficulty breaking lower, I entered a buy limit order and got a good price. 

Price moved in my favour shortly after. I used the M1 chart to trail my stop loss, moving it just below the low of the second most recent candle on the chart. As soon as price stalled, my trailed stop loss got hit and I exited at 1R profit.

However, price resumed moving in my favour, and would've hit my 3R profit target.

This stop loss might've been way too tight. The M1 chart shows greater detail than the M5 chart, so trailing a stop loss using the swing points on the M1 chart might strike a good balance between tightness and accuracy. 


Tight stop losses vs wide stop losses

When should you use a tight stop loss versus a wide stop loss? 

The definition of 'tight' or 'wide' is subjective, but I personally define a 'tight' stop loss as anything 5 pips or below (if trading intra-day). 

A 'wide' stop loss can be bigger, and is usually placed at a strategic location like a swing high or low, or a S/R level. A 'wide' stop loss can be further widened with a buffer to allow more 'breathing space' at a S/R level, in order to give S/R a chance to work. 

These are my thoughts. My preference has been towards using tight stop losses for intra-day trades. 

(I may expand this list later as I develop new thoughts)

When to use a tight stop loss 

- you are aiming for a high reward:risk ratio (i.e. over 2:1)
- you want to be out of a trade quickly for psychological reasons (the longer a trade takes, the more opportunity there is to make sub-optimal decisions)
- you expect the trade to move in your favour quickly and decisively (if price action is indecisive, you want to be out)
- you've already received signs of confirmation for your trade (e.g. if trading a trend, the trend should already be under way)
- you expect price to be one-directional with low probability of choppiness or a major pullback (e.g. a major trend, a breakout, a stop hunt, news release etc)
- you're comfortable with being wrong
- you prefer lots of small losses and the occasional big win
- you want to move the trade to breakeven as soon as possible
- you believe that winning trades should move in your favour quickly
- you trade low-probability setups
- (if trading intra-day) you like to trade volatile hours where spreads are tighter and you can get one-directional moves (e.g. London Open, London / NY overlap, Tokyo Open) 
- you trade a major currency pair with tight spreads, such as the EURUSD or USDJPY

When to use a wide stop loss

- you are aiming for a moderate reward:risk ratio (1:1 to 2:1) (larger R:R ratios are acceptable for longer-term trades)
- you believe that price may be choppy after your entry (e.g. a ranging market)
- you believe that your price forecast is correct, but you're unsure of your timing
- you'd prefer to be right
- you're comfortable with leaving trades open
- you are fading a move without confirmation (e.g. using a sell limit order to enter as price moves to the top of a range. A wide stop loss beyond the top of the range will give price room to 'breath' and turn in your favour)
- you prefer an even mix of wins and losses
- you manage your trades passively and like to walk away after entry
- you trade currency pairs with wide or fluctuating spreads
- you trade during quiet market hours where there's less market direction

Friday, December 12, 2014

11 Dec 2014: Daytrade #4

This was a trade I took just before I went to sleep.

I was checking the charts one last time and saw a bit of price action that I found interesting. A short-term support level had formed on the EURUSD on the M5 chart. I noticed that price had stopped bouncing off support, which told me that buyers were exhausted and the support level was going to break.

I quickly entered short, using a tight stop loss. I wanted support to break quickly and take out the stops lying underneath. 

Price poked through support, but only a bit. It then began to gyrate up and down. This wasn't the reaction I was looking for, so I got out at a nominal profit of 0.2R (enough to cover transaction costs and a bit). I managed to avoid a loss.

Because my stop loss was very tight, I was able to aim for a reward of 3R or so. 


Thursday, December 11, 2014

11 Dec 2014: Daytrade #3

Final trade for today. 

This trade took place in the first half of the Euro / US overlap session. Price on the AUDJPY plummeted 70 pips in the space of 5 minutes, before retracing to yesterday's low. This level was also the 50% retracement level of the 70 pip move, so to me, this looked like a good area of resistance.

I saw a small bearish reaction, and entered short here. In context of the massive volatility, I wanted price to move down, and move down quickly. 

The next candle was very hesitant, and didn't move down much. When I saw that price was retreating back towards my entry, I moved my stop loss to around breakeven. Price quickly took out my stop loss, and I managed to salvage a small 0.2R profit. 

This was a losing trade, but due to good trade management, I managed to get out in the green. 

In any trade, have some idea of how you want price to behave. If price isn't behaving as you predicted, it's usually a sign to be very cautious.

(click to enlarge)


11 Dec 2014: Daytrade #2

I closed this trade with a very tiny profit (around 0.2R).

I saw that price had broken the high of the range on the AUDJPY, but then fell back again below the high. To me, this looked like a breakout trap.

When price closed below the high of the range, I entered short.

Price continued to fall, but then as you can see, it halted halfway through the range. Whether this was the start of a retracement or a reversal, I didn't know. But my stop loss was tight, and I had actually moved it to -0.5R since price was halfway towards my profit target. Whether it was going to be a retracement or a reversal, my stop loss was likely going to get hit, so I took profit at 0.2R. 

At this point, I don't know what the market's doing. So I'll stop.

(click to enlarge)


11 Dec 2014: Daytrade #1

I tried trading the AUDJPY during the Asian session today. Price on the 5M chart had begun to fall, before stopping and forming a range. 

The H1 and H4 charts showed that the longer-term bears were in control, but the 5M chart showed an uptrend (the 60SMA was pointing up). However, price on the 5M chart had returned to the vicinity of the 60SMA, which showed that price may resume moving downwards again.

I looked to go short in the top of the range. When I saw a smaller bullish candle form at the top of the range, I saw this as a sign of buying momentum slowing down, and went short. 

The next candle broke the high of the range, and was again bullish. Seeing no evidence of bears taking full control, I closed the trade and ate a -0.6R loss. Price eventually broke upwards and would've taken out my stop loss.

I think my entry was a little premature. A better option would've been to wait and confirm a bearish reaction at the top of the range, and then enter with a sell limit order. I entered early, probably to be 'clever' but also because I was scared of missing out. 

(click to enlarge)


Wednesday, December 10, 2014

10 Dec 2014: Daytrade #1

Only had time to enter one trade today because of work. Only got an hour left before I sleep so I may enter another trade. Will see what happens. 

This trade occurred on the USDJPY just before the London open. On the H1 and H4 charts, the USDJPY had turned bearish, and I noticed that the majority of retail traders had become long (57%). It's not a huge majority, but everything seemed to line up to go short this time. 

Price had been moving down steadily for the last few hours. When it retraced to 119.000 and formed a doji, I took notice and waited what the next candle would be. When the next candle closed bearish, I went short, and took profit at 1.25R. I could've grabbed more, but you can see that price stalled after my entry, forming another doji. I decided to get out here.

I also changed my chart's background to white so I could print them out for my own personal hard-copy trading journal. 

(click to enlarge)


Tuesday, December 9, 2014

8 Dec 2014: AUDUSD daytrade #3

This was a trade I took at 3.30AM this morning. You know you're a trader when you think about trading and can't sleep.

The AUDUSD had been ranging for the last few hours. With the US session closing in a few hours, I believed that the range would hold, and went short when price bounced off resistance and retraced a bit. Rather than try to pick the tops and bottoms of a range, I think you're better off just trying to catch the high-probability 'meat' in the middle. The trade was in line with H4 and H1 momentum.

I took profit at 1.5R when price began to stall.

Back to sleep.

(click to enlarge)


Monday, December 8, 2014

8 Dec 2014: EURUSD daytrade

This was a loser.

I went short going into support during the start of the Euro / US overlap. The downward momentum looked pretty strong and was in line with the H1 and H4 charts. 

Support held very well, though. As you can see, price just bounced back quickly. 

I got out at -0.9R. I knew my stop loss was very likely going to get hit, so I decided to eat the loss at -0.9R instead of -1R. 

Was there anything wrong with my trade? I was depending on the Euro / US session open to break support quickly, and was prepared to move my stop loss to breakeven once price moved 1R in my favour (my target was around 2R).

If I'm going to trade the break of an S/R level, it'd seem better if I enter much earlier. That way I can move my stop loss to breakeven earlier, and there'd be less likelihood of being stopped out by 'noise' as the bulls and bears battle it out along the S/R level. There'd also be the chance to take profit if I was inclined. 

Either that, or I can wait for S/R to break and enter on the retracement.

Overall, this wasn't the best trade. I didn't give the market a chance to show how strong the bulls were at support, and entered blindly. 

(click to enlarge)


8 Dec 2014: AUDUSD daytrade #2

This trade was a bit iffy. Retail sentiment on the AUDUSD was still significantly bullish (65%) so I was looking for shorting opportunities. Price had risen to an obvious intra-day support / resistance level and stalled for a few candles.

I was aware of the strong upward move to the resistance level. I checked to see if it was news driven (it wasn't). When I concluded that the upward move was purely speculative, I thought it might be trappable. The two bearish candles at resistance gave me an opportunity to go short at a cheap price. I was aiming for a reward between 1.5R and 2R.

Price fell a bit after I opened my short, but then it stopped for a few candles. I'm always of the opinion that a winning trade should move in your favour quickly. When I saw that price couldn't break the low of the second bearish candle, I chose to take profit at 0.75R. It was half of my intended profit target.

As you can see, price eventually fell, but only a bit. It bounced back and resumed moving upwards and would've taken out my stop loss.

One thing to be mindful of is the 60SMA on the 5M chart (the dotted purple line). It was changing direction, and moving opposite the SMAs on the H1 and H4 charts. I should be more wary next time. This trade wasn't a high probability one (upward move to resistance was strong, 60SMA was turning). Due to good trade management, I managed to get out at a profit. 

(click to enlarge)


8 Dec 2014: AUDUSD daytrade

Price gapped lower on the market's open this morning, right below last week's low. Last week's low served as a resistance level, although price did break it for a short while (filling the gap) before retreating.

I attempted to trade the break of this morning's low. When price is marching into 'virgin' price levels that haven't been touched in months or years, it's tempting to become greedy and aim for a large reward. This is because support and resistance aren't really clear, and any old S/R levels from months or years ago aren't reliable. 

I tried to control my greed and aimed for a profit of 1.25R. I hit my profit target and closed the trade. At this moment, the downward move is stalling. 

Reasons why I took the trade:

1) Lower swing highs and lows were formed (especially at the 50% retracement level, which is a major bearish signal)
2) H4, H1 and M5 momentum were all bearish
3) Price was just beginning to poke below the previous major swing lows. I knew stops below the swing lows were just about to get hit. An entry with a tight stop loss would give me the opportunity to run those stops and profit at low risk.

(click to enlarge)


Sunday, December 7, 2014

AUDUSD Forecast for 8 Dec 2014 (and live calls from 24 Nov)

I spent this afternoon analysing the AUDUSD and coming up with a battle plan for tomorrow. This is what I think will happen.

According to OANDA, retail traders are still overwhelmingly bullish (69.8%), suggesting that the AUDUSD will continue to fall.


How price will behave during the Asian session tomorrow will depend on whether the AUDUSD opens with a gap, and where the gap's located.

But assuming there's no gap, I believe the market will open with the AUDUSD initially falling to last week's low, which will behave as support. 

Price will then rebound to 0.83500, trapping any bears who prematurely entered short. 0.83500 also serves as the 50% retracement level of the recent NFP-driven downswing. To me, this looks like an excellent resistance level, and any bears who closed their positions on Friday will re-enter around this level at a good price. Price will then resume moving downwards. I'd expect last week's low to break either on Monday or Tuesday.

There is a medium-impact news item coming out on Monday (ANZ Job Advertisements m/m) but I don't think it'll have much effect. China's trade balance will also be released some time tomorrow, which may be a wild card. Chinese news releases will tend to impact the AUDUSD significantly. Since the time of this news release is unknown, the only thing you can do is to keep an eye on your stop loss. 

(click to enlarge)


My live calls from 24 November 2014

I made three live calls on 24 November 2014, using the 4H timeframe. How did they go?

EURUSD

I predicted that price would retrace to 1.25000 before falling again. That actually happened.

Forecast:


Reality:


I would say this forecast was 100% correct. 

XAGUSD

I predicted that silver would retrace to 17.000. Price retraced to 16.723, only 28 pips shy of 17.000. It then resumed moving downward to 15.000 as predicted.

Forecast:


Reality:


I didn't quite get the retracement fully correct. If I did try to trade this, I probably would've missed my entry. Besides that, the forecast's directional move was correct. I would give this 75%. 

SGDJPY

I predicted that price would retrace to 90.000 before resuming upwards to 91.000. It only retraced to 90.342, but it did move up to 91.000. This forecast was partially correct.

Forecast:


Reality:


I would rate this forecast 60%. The retracement was too shallow and I would've missed my entry if I tried to trade it. I was correct that price would return to hit 91.000.

Conclusion

My forecasts were pretty good. The worst that would've happened was missing my entry. 

Saturday, December 6, 2014

5 Dec 2014: USDCAD daytrade #3

I tried to short the USDCAD a second time, this time successfully. 

I saw a very strong retreat on the USDCAD and regarded this as a sign of bulls starting to get out before the market begins closing. A long wick appeared, followed by a strong bearish candle. 

Price fell to last week's high, which acted as support. I stayed out for awhile, but when I noticed that price was ranging, rather than rebounding upwards, I saw this as weakness. I opened a short after the 7th candle of ranging price action, with a tight stop loss above the range. 

The bottom of the range broke, but it wasn't the strongest breakout. I got out at 1.5R when price began to hesitate. I seem to be getting out between 1R and 2R most of the time. I suppose this is a psychological trait? 

I walked away with a profit of 1.5R, which is not bad. 

(click to enlarge)


Friday, December 5, 2014

5 Dec 2014: USDCAD daytrade #2

I tried to fade the USDCAD after the NFP and Canadian figures were released awhile ago. This was based on the belief that bulls would start closing their positions before the market closes for the weekend.

Price had hit last week's high and the previous major swing high, forming a nice wick. I went short after the next candle opened, and looked for price to fall quickly. It didn't fall much at all, and stuck around the resistance level. When it kept pushing upwards, I decided to close the trade at a -0.8R loss rather than wait for it to hit my stop loss. Price surged upwards shortly after, taking out the stops above.

There were some warning signs that bullish momentum was strong:

1) The bullish candles on the upswing had very small wicks, especially on top. This showed little evidence of bears pushing back.
2) There were 3+ candles of the same colour
3) Price moved alot quicker going upward than downward.
4) There was no lower major swing high that formed. A lower major swing high would've shown proof of bears competing against each to get their shorts filled first. This would've been a good sign of bearish strength.

(click to enlarge)


5 Dec 2014: USDCAD daytrade

This was a big day for the USDCAD. The US NFP figure and Canadian employment and trade figures all came out tonight at the same time, resulting in a gigantic bullish surge. The USDCAD gained 50 pips in five minutes.

The figures themselves were perfect. I was hoping for US NFP to be bullish, and Canadian figures to be bearish, which would result in a one-direction bullish spike. This is exactly what happened. The reason I say this is perfect is that the USDCAD has been bullish for most of this week (refer to H1 chart below - bears took the USDCAD down on Monday, but since then bulls have been moving in all week). Another bullish surge on the USDCAD would mean that there'd be many daily, weekly, intra-day and news traders holding long positions that they'd need to liquidate before the market closes for the weekend. There should be a good opportunity to short the USDCAD later tonight. 

I'm still waiting for the opportunity to fade the USDCAD, but I did take a short-term long on the 50% retracement of the bullish spike. I was aiming for a reward of 3R, but when price hovered at 1R and didn't break the lower swing high, I chose to get out. Price turned downward and would've taken out my stop loss.

(click to enlarge)


4 Dec 2014: USDCHF daytrade

This was a discretionary trade on the USDCHF. 

The European Central Bank had just held a press conference, causing the USDCHF to plummet like a rock. While the H1 and H4 charts showed bullish momentum, I didn't think the dive on the USDCHF was worthy of fading, and so stayed out. Market movements around central bank decisions are usually authentic and un-trappable. 

When price formed support, I saw the break of this support level as a good area to go short, using a very tight stop loss. I knew that short-term momentum was extremely bearish, and it wouldn't take much to break this support level.

When the support level did break, I entered short with a VERY tight stop loss. My reasoning was that this support level was either going to collapse entirely on its first test, or it was going to hold strong and trap alot of bears. If it was going to collapse, then you don't need a large stop loss. Price should pass through support like a hot knife through butter.

Indeed, this is what pretty much happened. However, there was a tiny bullish retracement. It wasn't that big, and it didn't hit my stop loss. However, I decided to manually close it at breakeven, just in case.

Price resumed moving downward, hitting my intended profit target at 4R. 

I think the lesson is that if your stop loss is very tight to begin with, there's little need to get out at breakeven. A tiny loss is almost as inconsequential, but I missed out on a relatively large reward of 4R+. 

The premise of the trade was very good. The management of the trade wasn't as good.

(click to enlarge)

Wednesday, December 3, 2014

3 Dec 2014: USDJPY daytrade #3

This was a wildly speculative trade. ADP NFP numbers had just come out. These are unofficial NFP numbers, but they still have a major impact on the market and foreshadow the official NFP figures that come out on Friday. 

Anyway, the figure was bad and the USDJPY dived. I had been looking for an opportunity to go long on the USDJPY, in line with H1 and H4 bullish momentum. However, I didn't like trading against the NFP release. I saw yesterday's high in conjunction with the 50% retracement level of the major upswing as a good area of support. 

Price quickly fell following the release of the ADP NFP, but then stalled at precisely yesterday's high. As you can see on the chart, price did not fall for two candles. I saw this as a good opportunity for a low-probability, high-reward trade and went long. My reward was 6.5R, so I only needed something like a 15% win probability to make it worthwhile.

Price advanced for a short time and my reward got up to 1.5R. However, I chose not to close it. I didn't enter a low-probability trade against the news for a measly 1.5R. I wanted to be paid off big.

However, the upward movement halted pretty quickly and turned downwards. I was hoping for bearish news traders to be trapped. When this didn't eventuate and I saw that the candle was closing bearish, I closed my trade at breakeven. 

Overall, I think this was a pretty good trade, albeit a little too 'heroic'. I only needed a win probability of 15% to have made it worthwhile. I managed to get out at breakeven due to a well-placed entry.

(click to enlarge)


Update:

The bearish news traders did end up getting trapped. My timing was just a bit out. Oh well.

(click to enlarge)


3 Dec 2014: GBPUSD daytrade

This was a pretty dumb trade. The London session had just started and price looked to be going down.

However, there were a few obstacles:

1) There was a major multi-day support level around 1.56000
2) Four big news items were coming out later in the session

Because 1.56000 was a multi-day support level, this meant that there'd be longer-term buyers moving into the market and bidding against each other to get their longs filled. 

Also, the upcoming schedule of big news releases meant that many short-term traders would be staying out. 

This combination meant that price would likely be choppy and non-directional. If it was going to move down, the downward move would be short-lived and unpredictable as longer-term bulls tried to fill their longs.

Despite this, I looked for an opportunity to go short. Price had just broken yesterday's low, but then quickly retreated upward. To me, it looked like a failed breakout. I was looking for yesterday's low to break fully, and go short on the retracement back to yesterday's low. 

Price did break yesterday's low again, pushing price lower than previously, but not by much. However, I was getting itchy and classed it as a sufficient breakout, so I looked for a retracement to get in short. 

The retracement did occur and I went short at a good price, but price quickly rebounded upwards. I moved my stop loss to breakeven, then manually closed at a profit of 0.3R.

Intuitively, I knew this was a dumb trade. There wasn't much that supported going short in the near-term. Many short-term bears would be staying out until all the big news items are released, leaving only longer-term bulls in the market. 

I decided to sit the session out after this. 

(click to enlarge)


3 Dec 2014: USDJPY daytrade #2

This trade took place shortly after I closed my previous short.

I went long off a support level at 119.300. This was the previous day's high, and was located near the 50% retracement level of the most recent bullish swing. H4 and H1 momentum were both bullish so I felt pretty confident with this trade.

I was actually expecting price to fall lower, which is why I didn't trade the first few bullish 'confirmation' candles. It was only once price ranged for awhile did I accept that price wasn't falling further. 

I went long with a tight stop loss after seeing another bullish candle form, and took profit at 1.75R. I honestly feel that there's alot more potential for this trade as yesterday's high has already been broken today, leaving nothing but air at the higher price levels. However, the first three hours of the Tokyo session were coming to an end, and volatility usually drops after this time.

(click to enlarge)


3 Dec 2014: USDJPY daytrade

I took a counter-trend trade on the USDJPY this morning. Price had been rising during the Tokyo session before it began to turn downward and retrace. I asked myself where the retracement would end? I identified a good potential support level around 119.300. This was yesterday's high, and was also located at the 50% retracement level of the bullish move. 

I then reasoned that if price was likely to fall to this level, why not short it until then? When I saw the potential of a lower swing high form, I felt this was a good place to short the USDJPY. I used a very tight stop loss, and took profit at 1.5R. I could've made up to 3R.

(click to enlarge)


Tuesday, December 2, 2014

2 Dec 2014: EURJPY daytrade #3

This was a counter-trend today. Price on the EURJPY was hitting yesterday's high. From my own quantitative study, I know that reversals will tend to occur during the Europe / US overlap session, so if the EURJPY was to reverse, this would be a good time and price level to do it (the previous day's high and low tend to act as resistance and support). 

However, I also know that counter-trend trades are dangerous. I quickly debated with myself if I should go for a small or large reward, and opted for small (1R reward).

I saw a lower swing high being established on the 5M chart, and went short. I took profit just above 148.000, which would've acted as short-term support, and won 1R. 

The thing about trading the day's reversal is that even though price may've stopped advancing, the reversal itself may not be that big, which is also why I opted for 1R. 

(click to enlarge)


2 Dec 2014: EURJPY daytrade #2

This was a low-probability, high-reward discretionary trade. 

Price on the EURJPY was running into resistance along 148.000. I saw a weak bearish reaction (small bear candle), followed by a bullish candle which broke the bearish candle's high. To me, it screamed that 148.000 was going to break, so I went long, setting my SL just below the bear candle's low. I originally aimed for a reward of 3R, about 15 pips above 148.000. 

148.000 did break and my call was correct, but price didn't quite reach 3R. I could've profited at 2R. I exited at 0.75R.

(click to enlarge)


2 Dec 2014: EURJPY daytrade #1

Saw some bullish price action off a short-term support level on the EURJPY 5M chart.

I went long after seeing a wick form off support, and the next candle being extremely bullish (no wicks, especially on the bottom). Rather than wait for the bullish candle to close before entering, I entered the bullish candle about 3 minutes in, mainly because it had no wick on the bottom and it had just broke the previous bearish candle's high.

I was hoping 148.000 would break, and aimed for 3R reward, but prematurely took profit at 1R. As you can see, price didn't reach 3R, but I could've made 2R if I held on. I exited at 1R since it was running into the top of the range and seemed to have trouble breaking the previous swing high (the swing high broke in the next candle).

(click to enlarge)


2 Dec 2014: AUDUSD daytrade

This was a purely discretionary trade where I tried to use market psychology. 

The RBA had just announced that it was holding interest rates. During the first five minutes, news traders caused the AUDUSD to rally, but it began to retreat. I saw this as an opportunity to trap bullish news traders and went short towards the close of the 5M candle. I aimed for a reward of 3R, just above 0.84500. 

Price began stalling at around 1.5R, where I moved my stop loss to breakeven. When I saw the tiny bullish pinbar form, I decided to take profit. A 50% retracement would've taken out my B/E stop loss, so I didn't have a choice. 

Shortly after, price began marching upwards again. Did the trappers end up getting trapped? 

(click to enlarge)


Thursday, November 27, 2014

26 Nov 2014 Trades: EURJPY & EURNZD

Opened two trades today using my 'Plutus' system, although I adapted the system's rules to what I saw on the chart. This was a combination of discretionary and mechanical trading, and in both instances I won the majority of the move.

EURJPY

I spotted a low volatility, high volume candle off 147.000, a significant round number level. 

When I see an entry signal, I want a story behind it. In this case, I felt sell limit orders along 147.000 were being triggered, and went short. I took profit some distance above the previous major swing low, which was ideal. Shortly after I took profit, price turned upwards and would've taken me out. 


EURNZD

It's a similar story with the EURNZD. I spotted a  low volatility, high volume candle off 1.59000, and figured that a whole bunch of buy limit orders were hit. I went long and took profit just below the previous swing highs (marked on the chart below). Price turned shortly after and would've stopped me out, so my profit target was well-placed. 


Monday, November 24, 2014

Live calls: XAUGUSD, EURUSD, SGDJPY

My live calls for swing trades this week. I want to see how good my discretionary forecasting is. I'm using retail sentiment as a contrarian indicator, in conjunction with technical analysis (mainly Fib levels + big round numbers).

XAGUSD

Retail sentiment: Strongly bullish (from OANDA: blue is long, orange is short)


I expect price to turn south once it hits 17.000. Reasons: major S/R level, near 61.8% fib level, round number.

EURUSD

Retail sentiment: Moderately bullish (from OANDA)


Price will turn at 1.25000 and break support at 1.24000 on the back of Draghi's ECB speech.

SGDJPY

Retail sentiment: Extremely bearish (from Alpari)


This is an exotic cross-pair, but the price action and market structure look very clean. I expect a retracement to 90.000 (S/R, BRN + 50% fib level), and then price to rise.